
Emissions Reduction Progress
Oregon is forecast to reach 60% emissions reduction by 2050
Under current state programs, policies and laws, the latest analysis in 2022 forecasts Oregon transportation greenhouse gas emissions reduction will reach about 60% below 1990 emission levels by 2050.
That’s short of the state’s 80% reduction goal, but a big improvement from 2018, the most recent multi-agency emissions reduction forecast led by the Oregon Department of Transportation. Visit the About page to learn more about the objectives and actions that underpin Oregon’s emissions reduction work.
Closing the gap: reaching 80% reduction by 2050

To close the gap from 60% to 80% by 2050, state agencies, local governments, and the legislature must do more in both objectives, and across all categories of actions.
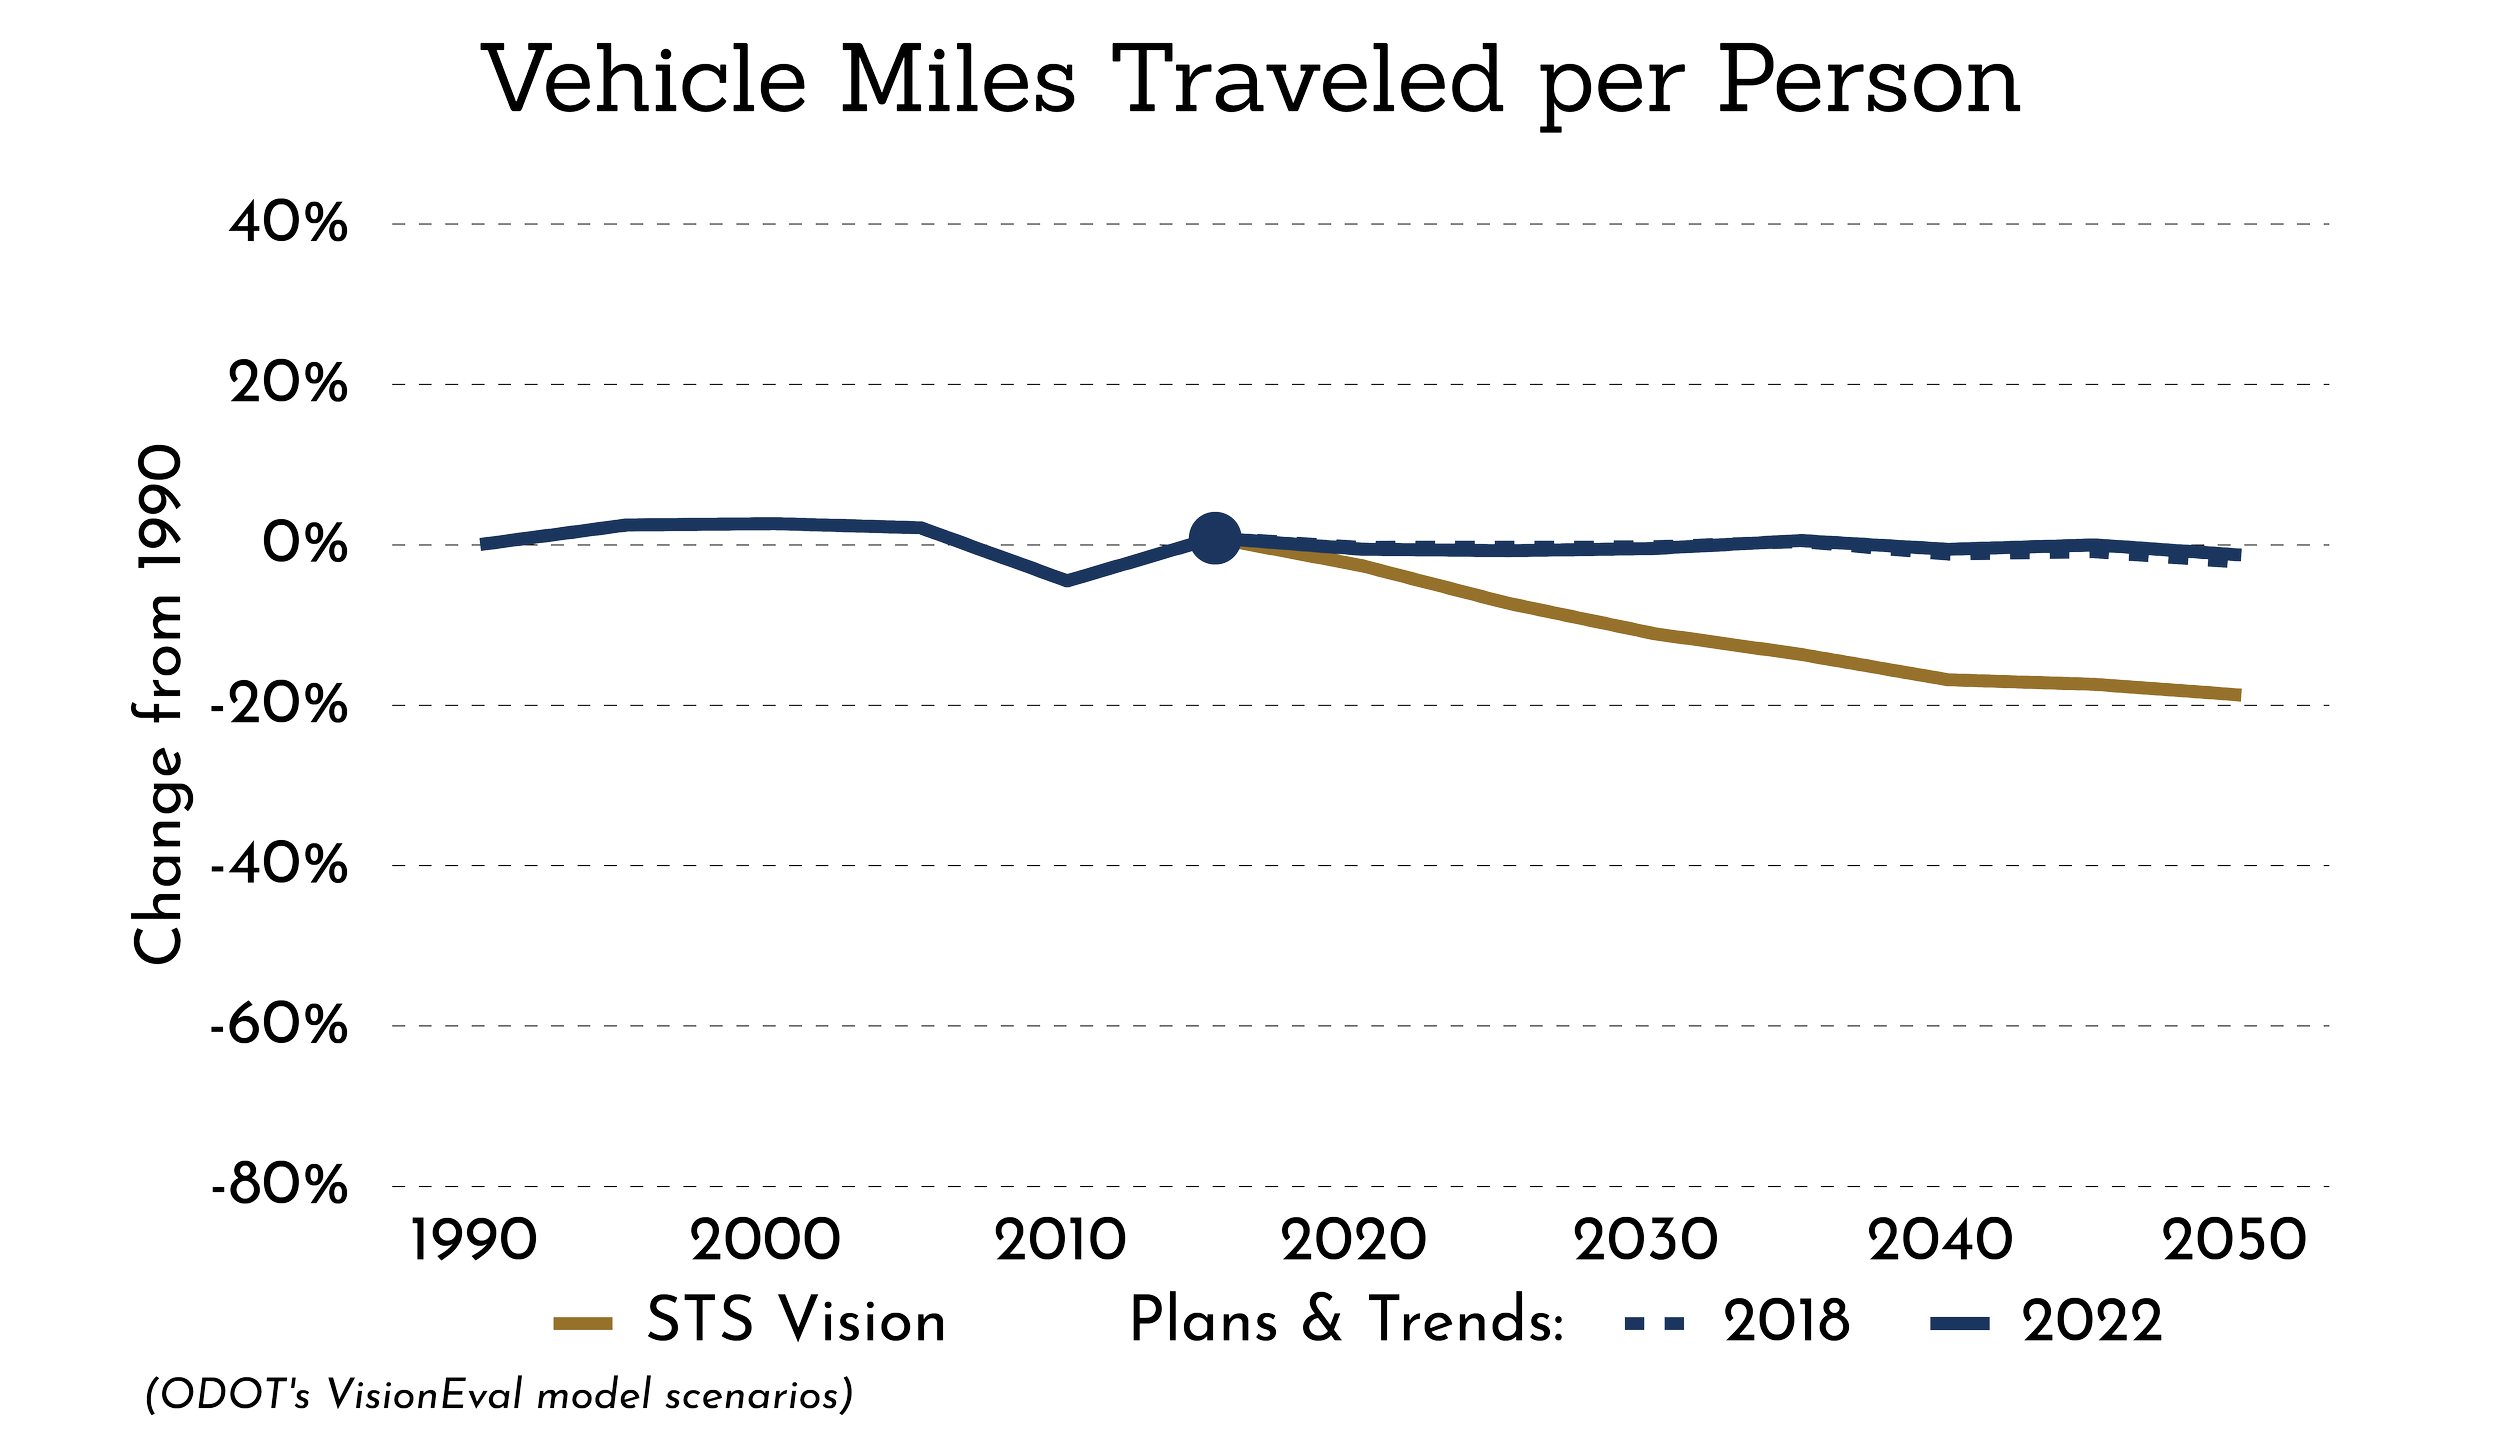
Further reducing growth in vehicle miles traveled
This objective has the most opportunities for improvement. Current trends suggest that Oregonian’s driving habits won’t change much through 2050. The state must take action to reduce how far and how often people drive by supporting more use of active and non-driving transportation like biking, walking and rolling, and transit. An added benefit of fewer and shorter vehicle trips will be a safer, more efficient, and better experience for people using non-driving modes.
Visit the pages on Land Use; Transportation Options; System Operations; and Pricing, Funding and Markets to learn more about ways to improve.

Further cleaning up each vehicle mile
Oregon has made significant progress here in the last few years. The challenge with this objective will be to stay the course and ensure fuel and vehicle regulations passed in the past few years are implemented successfully. State agencies will also need to work together to ensure the new vehicles using low emission fuels will have enough places to charge and fuel up.
Learn more about opportunities to improve this objective on the Vehicle Technology, Fuel Technology, and System Operations pages.
Airplanes, trains, boats, and other vehicles
State government has less authority in these categories, but many of the opportunities in other sectors are present for these vehicles, too.
2018 forecast vs 2022 forecast: what changed?
In 2018, emissions forecasts created by ODOT said Oregon would only reach about 20% emissions reduction below 1990 levels by 2050 for cars, trucks and SUVs. (Larger vehicles were not part of that forecast.)
State agencies responded to the 2018 forecast by directing more funding to climate-friendly programs, further revising policies, and adopting aggressive new regulations on vehicles and fuels.

2021 and 2022 were critical years for emissions reduction in Oregon. New rules and regulations adopted by the departments of Environmental Quality and Energy will reduce emissions from vehicle fuels and clean up each mile driven:
The Advanced Clean Trucks rule requires an increasing percentage of truck sales in Oregon to have zero tailpipe emissions; 40% - 75% of sales by 2035, depending on truck size.
The Clean Fuels Program expansion rule requires Oregon fuel providers to significantly reduce emissions from fuels through 2035. These changes will result in almost 50% reduction in tailpipe greenhouse gas emissions.
The Advanced Clean Cars II rule requires all new passenger cars, trucks and SUVs sold in Oregon to be zero tailpipe emissions by 2035.
Clean Energy Targets requires reduced electricity-related emissions for the two largest Oregon electricity utilities, meaning nearly all electricity used in Oregon will be emissions-free by 2040.
In 2022, ODOT factored in these investments, policies and rules made over the past four years, and included other types of vehicles in the emissions forecast, like delivery cars, semi-trucks, and buses.
The 2022 forecast also included factors that are largely out of the state’s control, like:
Vehicle manufacturer plans to shift production to electric and other low emission vehicles.
Updates to federal CAFE regulations.
Updates to Oregon population and income forecasts.
Beyond 2022, these new ODOT and state agency policies will have an impact through 2050:
Changes to Oregon Transportation Planning rules, which will require larger cities to plan for “climate friendly areas” with increased density, mixed use, and multimodal transportation options.
A big increase in funding to active transportation and transit projects in ODOT’s 2024-2027 project budget allocation — $255 million over three years — which is nearly double the money from the previous three-year budget cycle.
ODOT committed $100 million over five years to build out more public EV charging infrastructure along major roads and in Oregon’s communities.
The charts below give more context to forecasted trends through 2050 for cleaning up each vehicle mile.
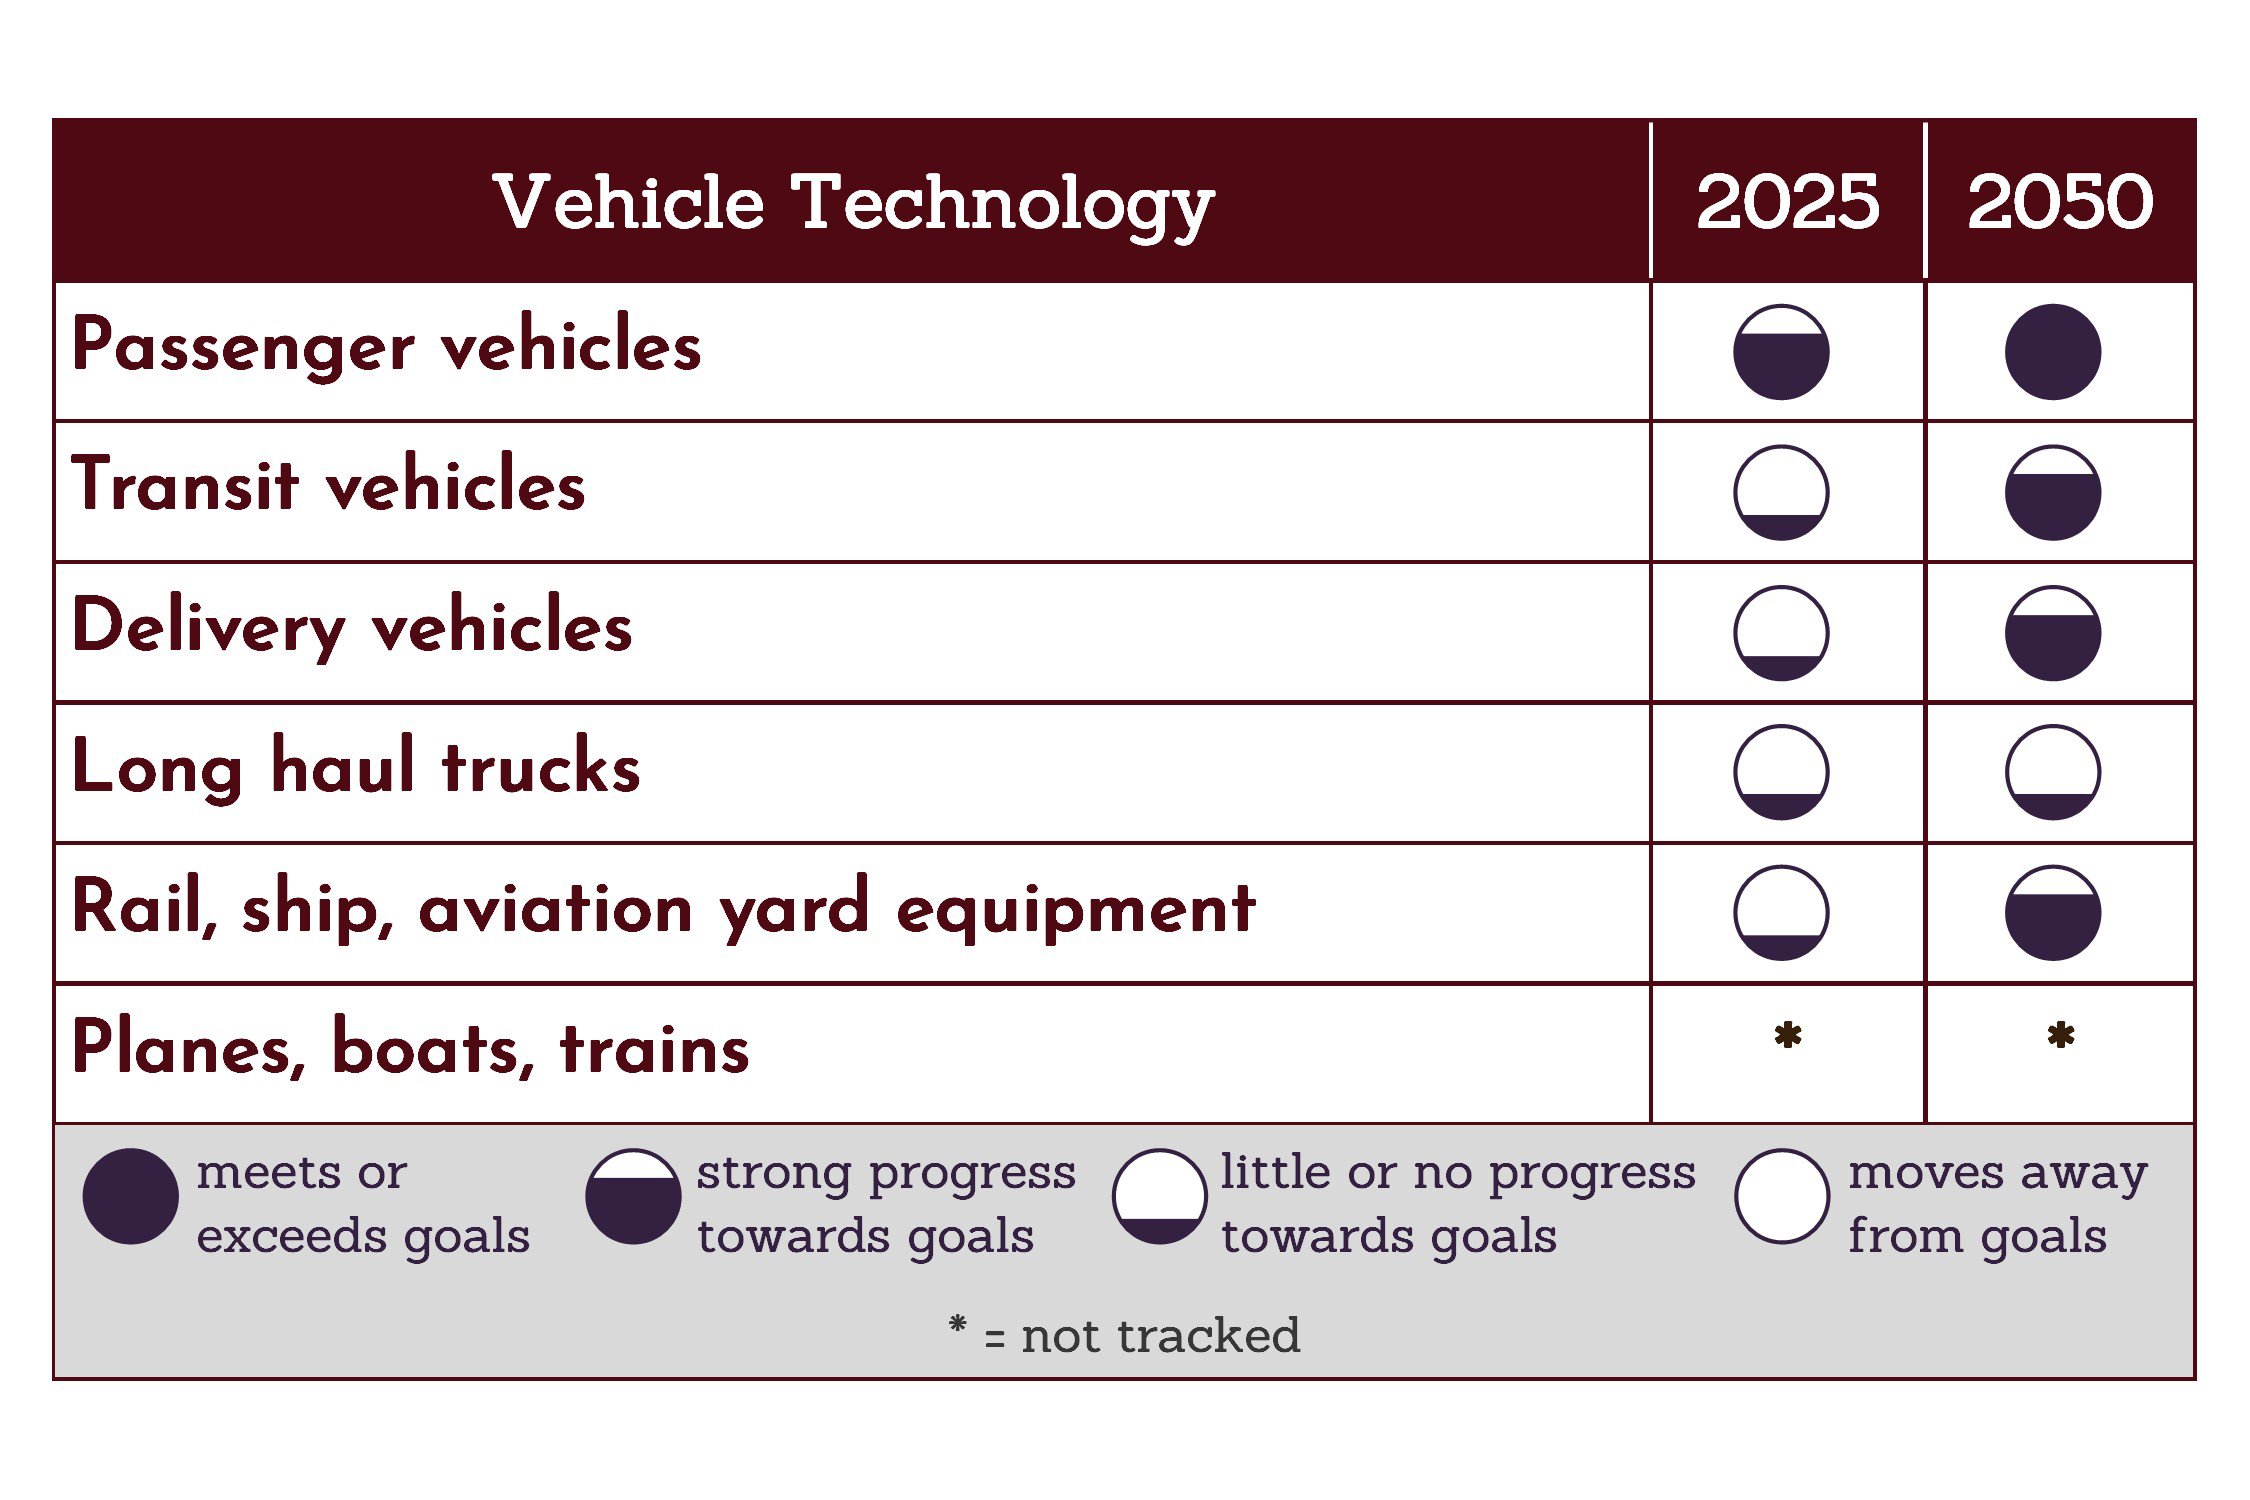
Vehicle Technology


New Oregon regulations will increase the number of registered electric cars, trucks and SUVs, and make vehicles powered by gasoline and diesel more efficient.
See the Passenger Vehicle Technology page for more details. Also visit the Resources page for a comparison of passenger vehicle and heavy truck adoption regulations compared to national standards.
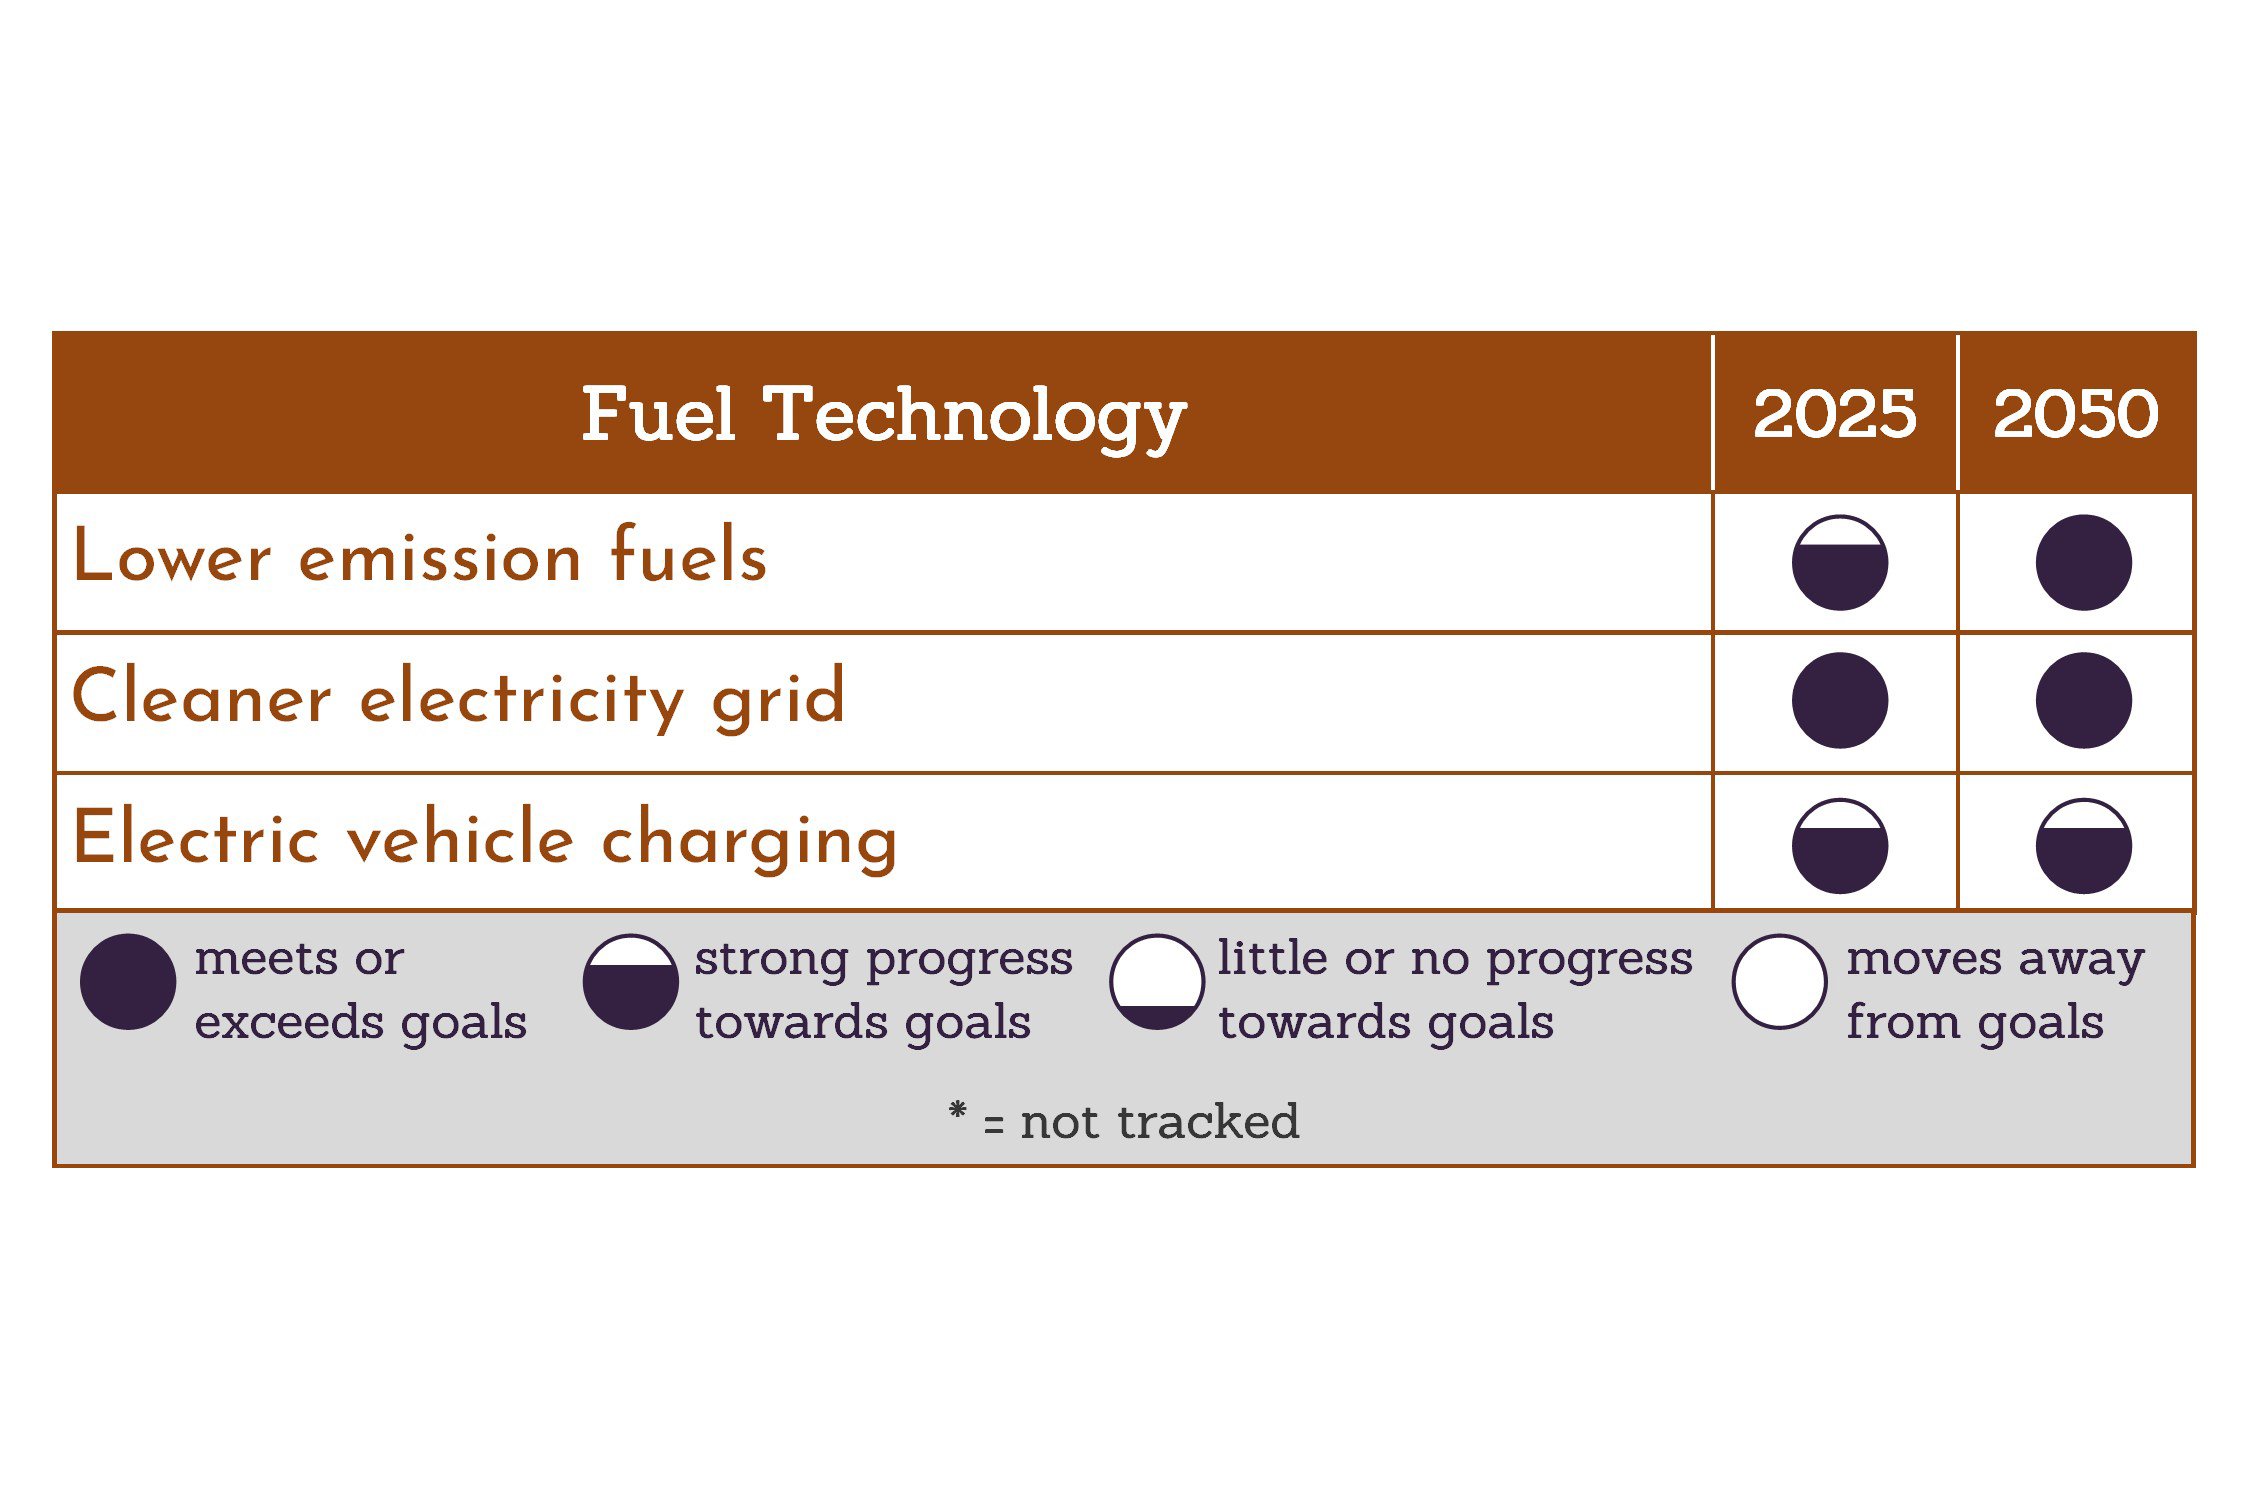
Fuel Technology


New Oregon regulations and laws will lower the carbon intensity of gasoline, diesel, and electricity, which are common fuels used to power cars, trucks and SUVs. A lower carbon intensity translates into less greenhouse gas emissions. See the Lower Emission Fuels and Cleaner Electricity Grid pages for more details.
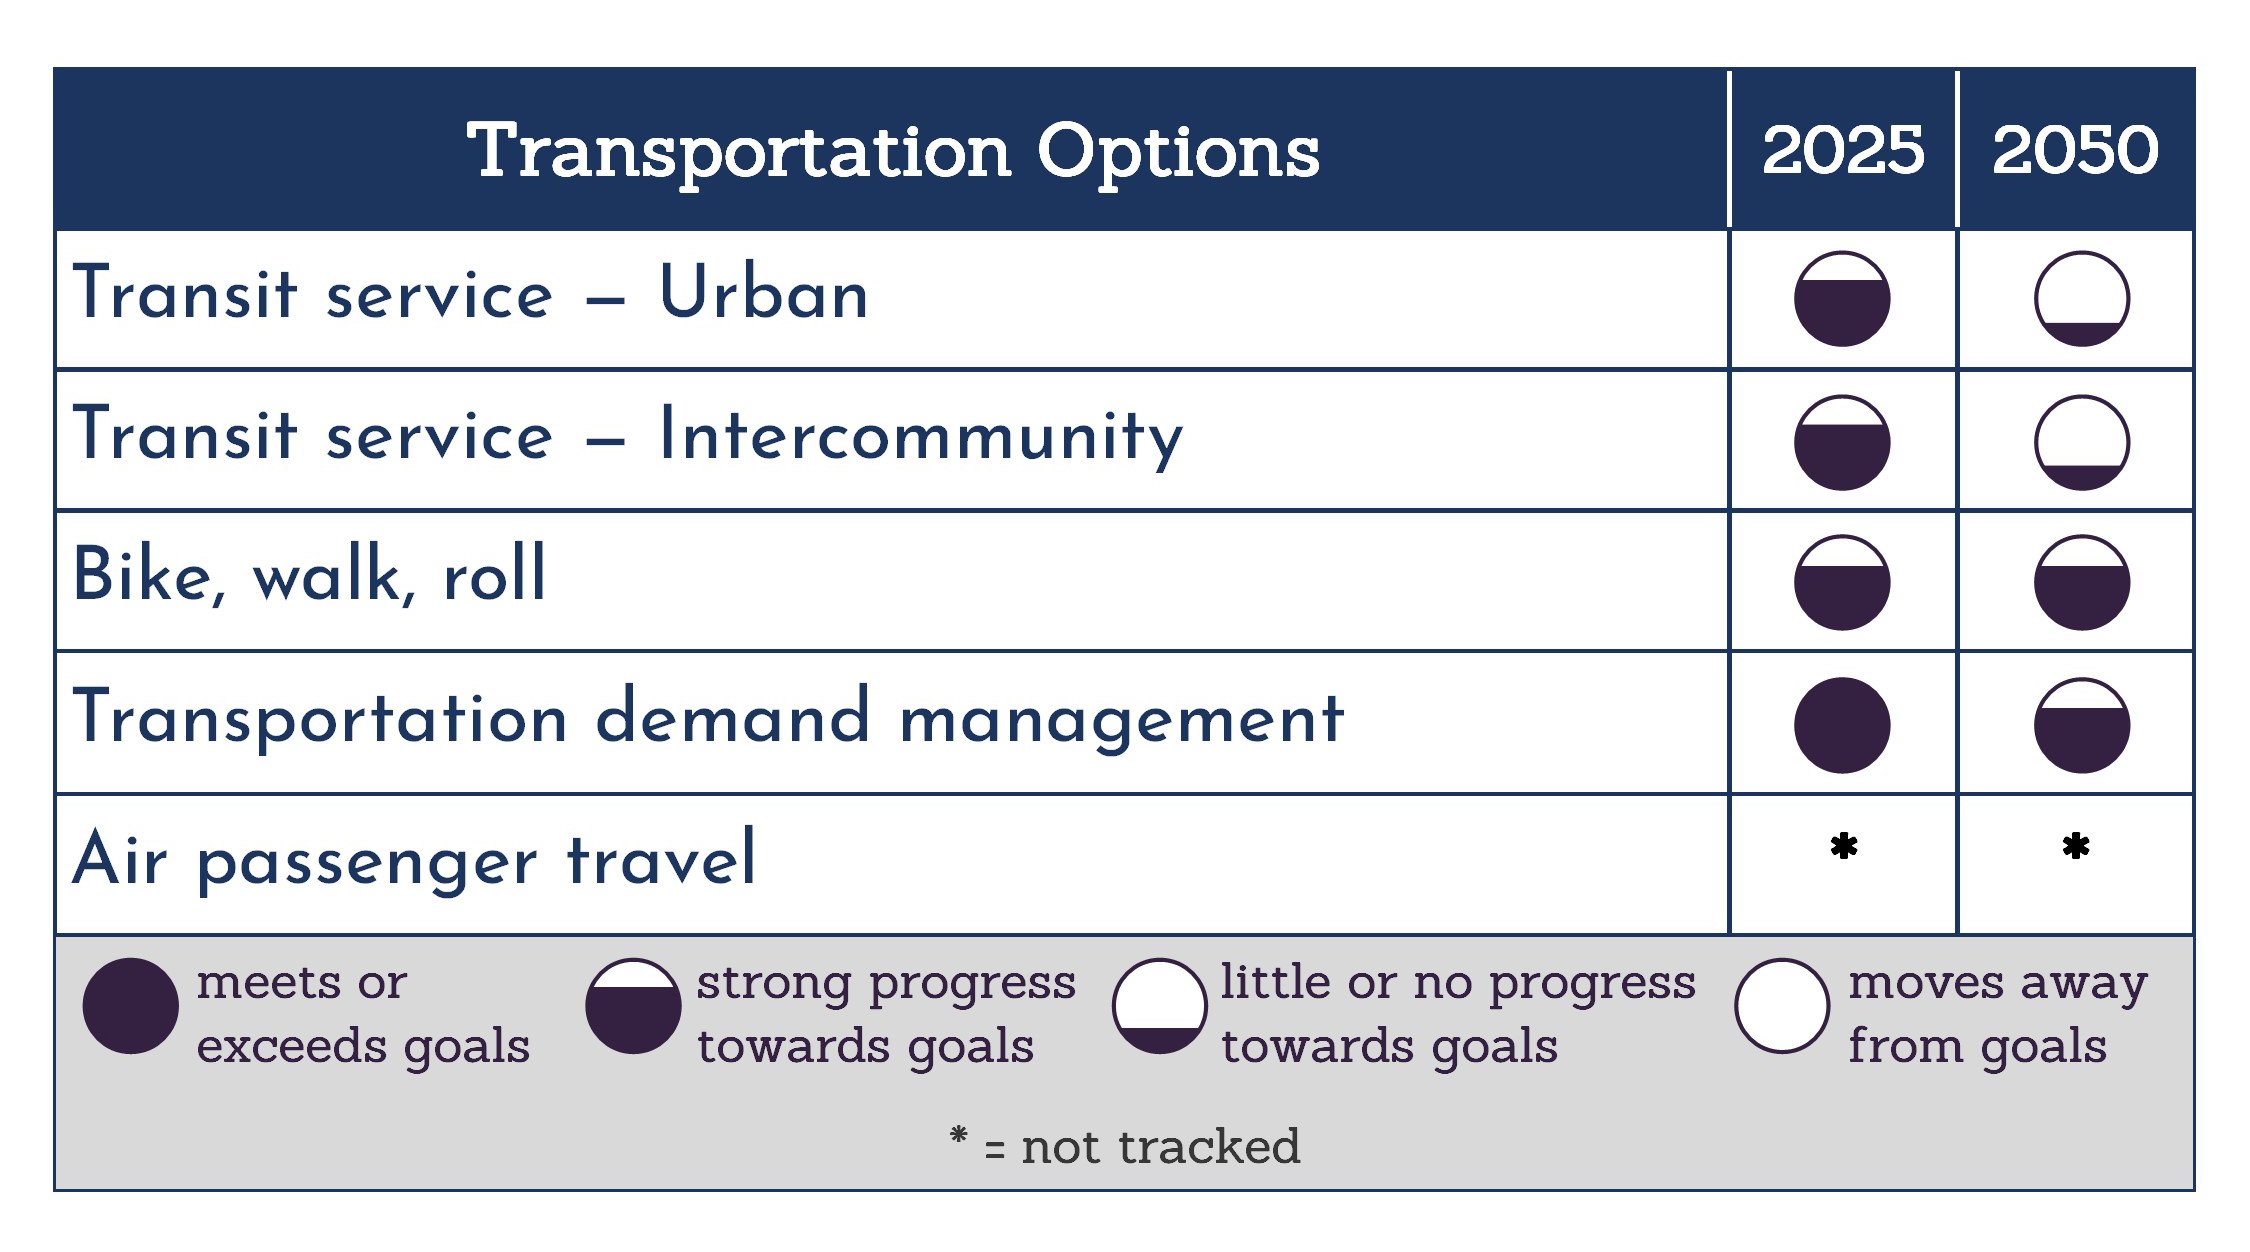
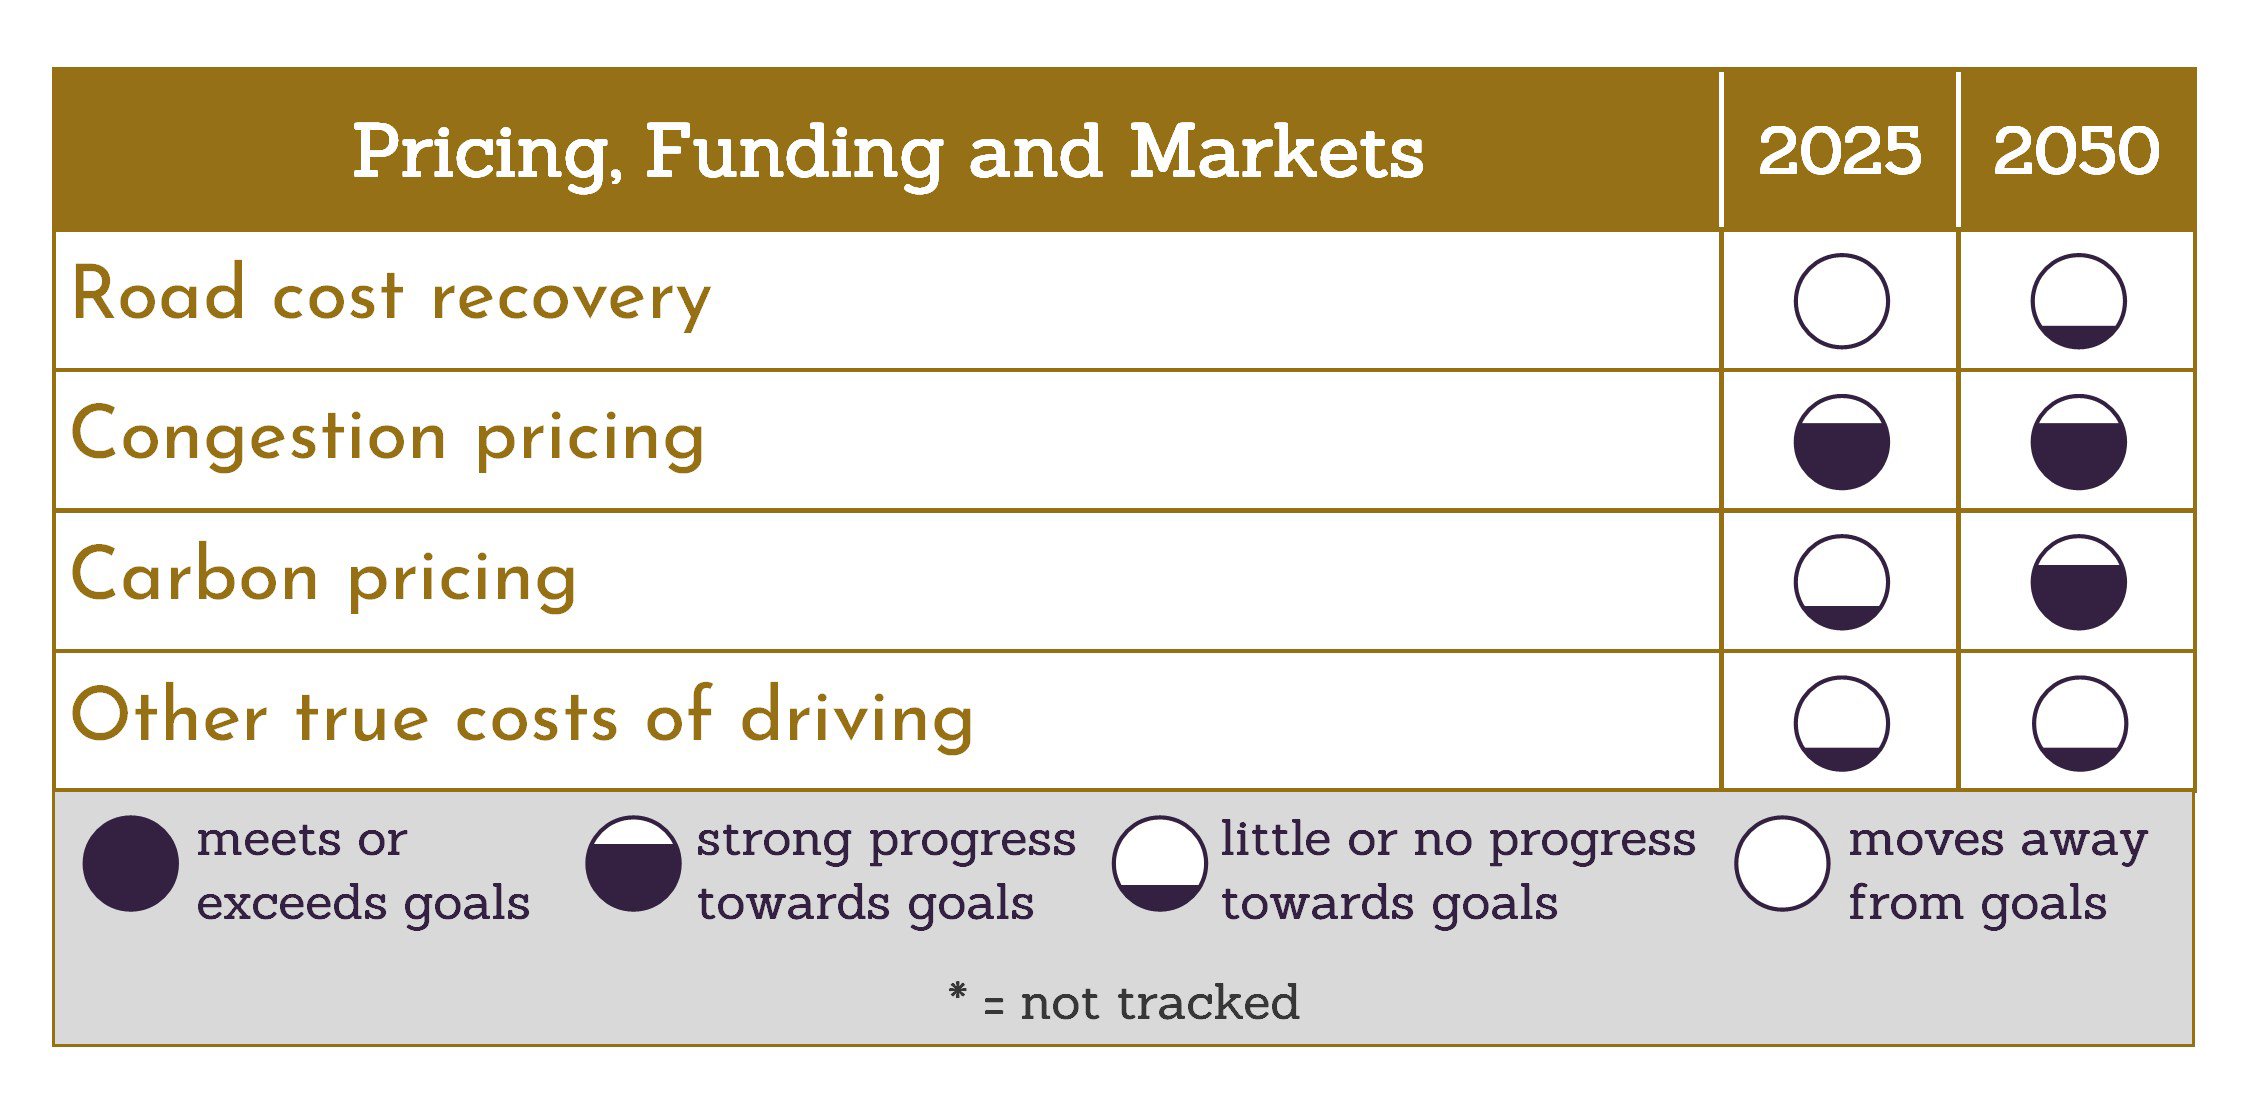
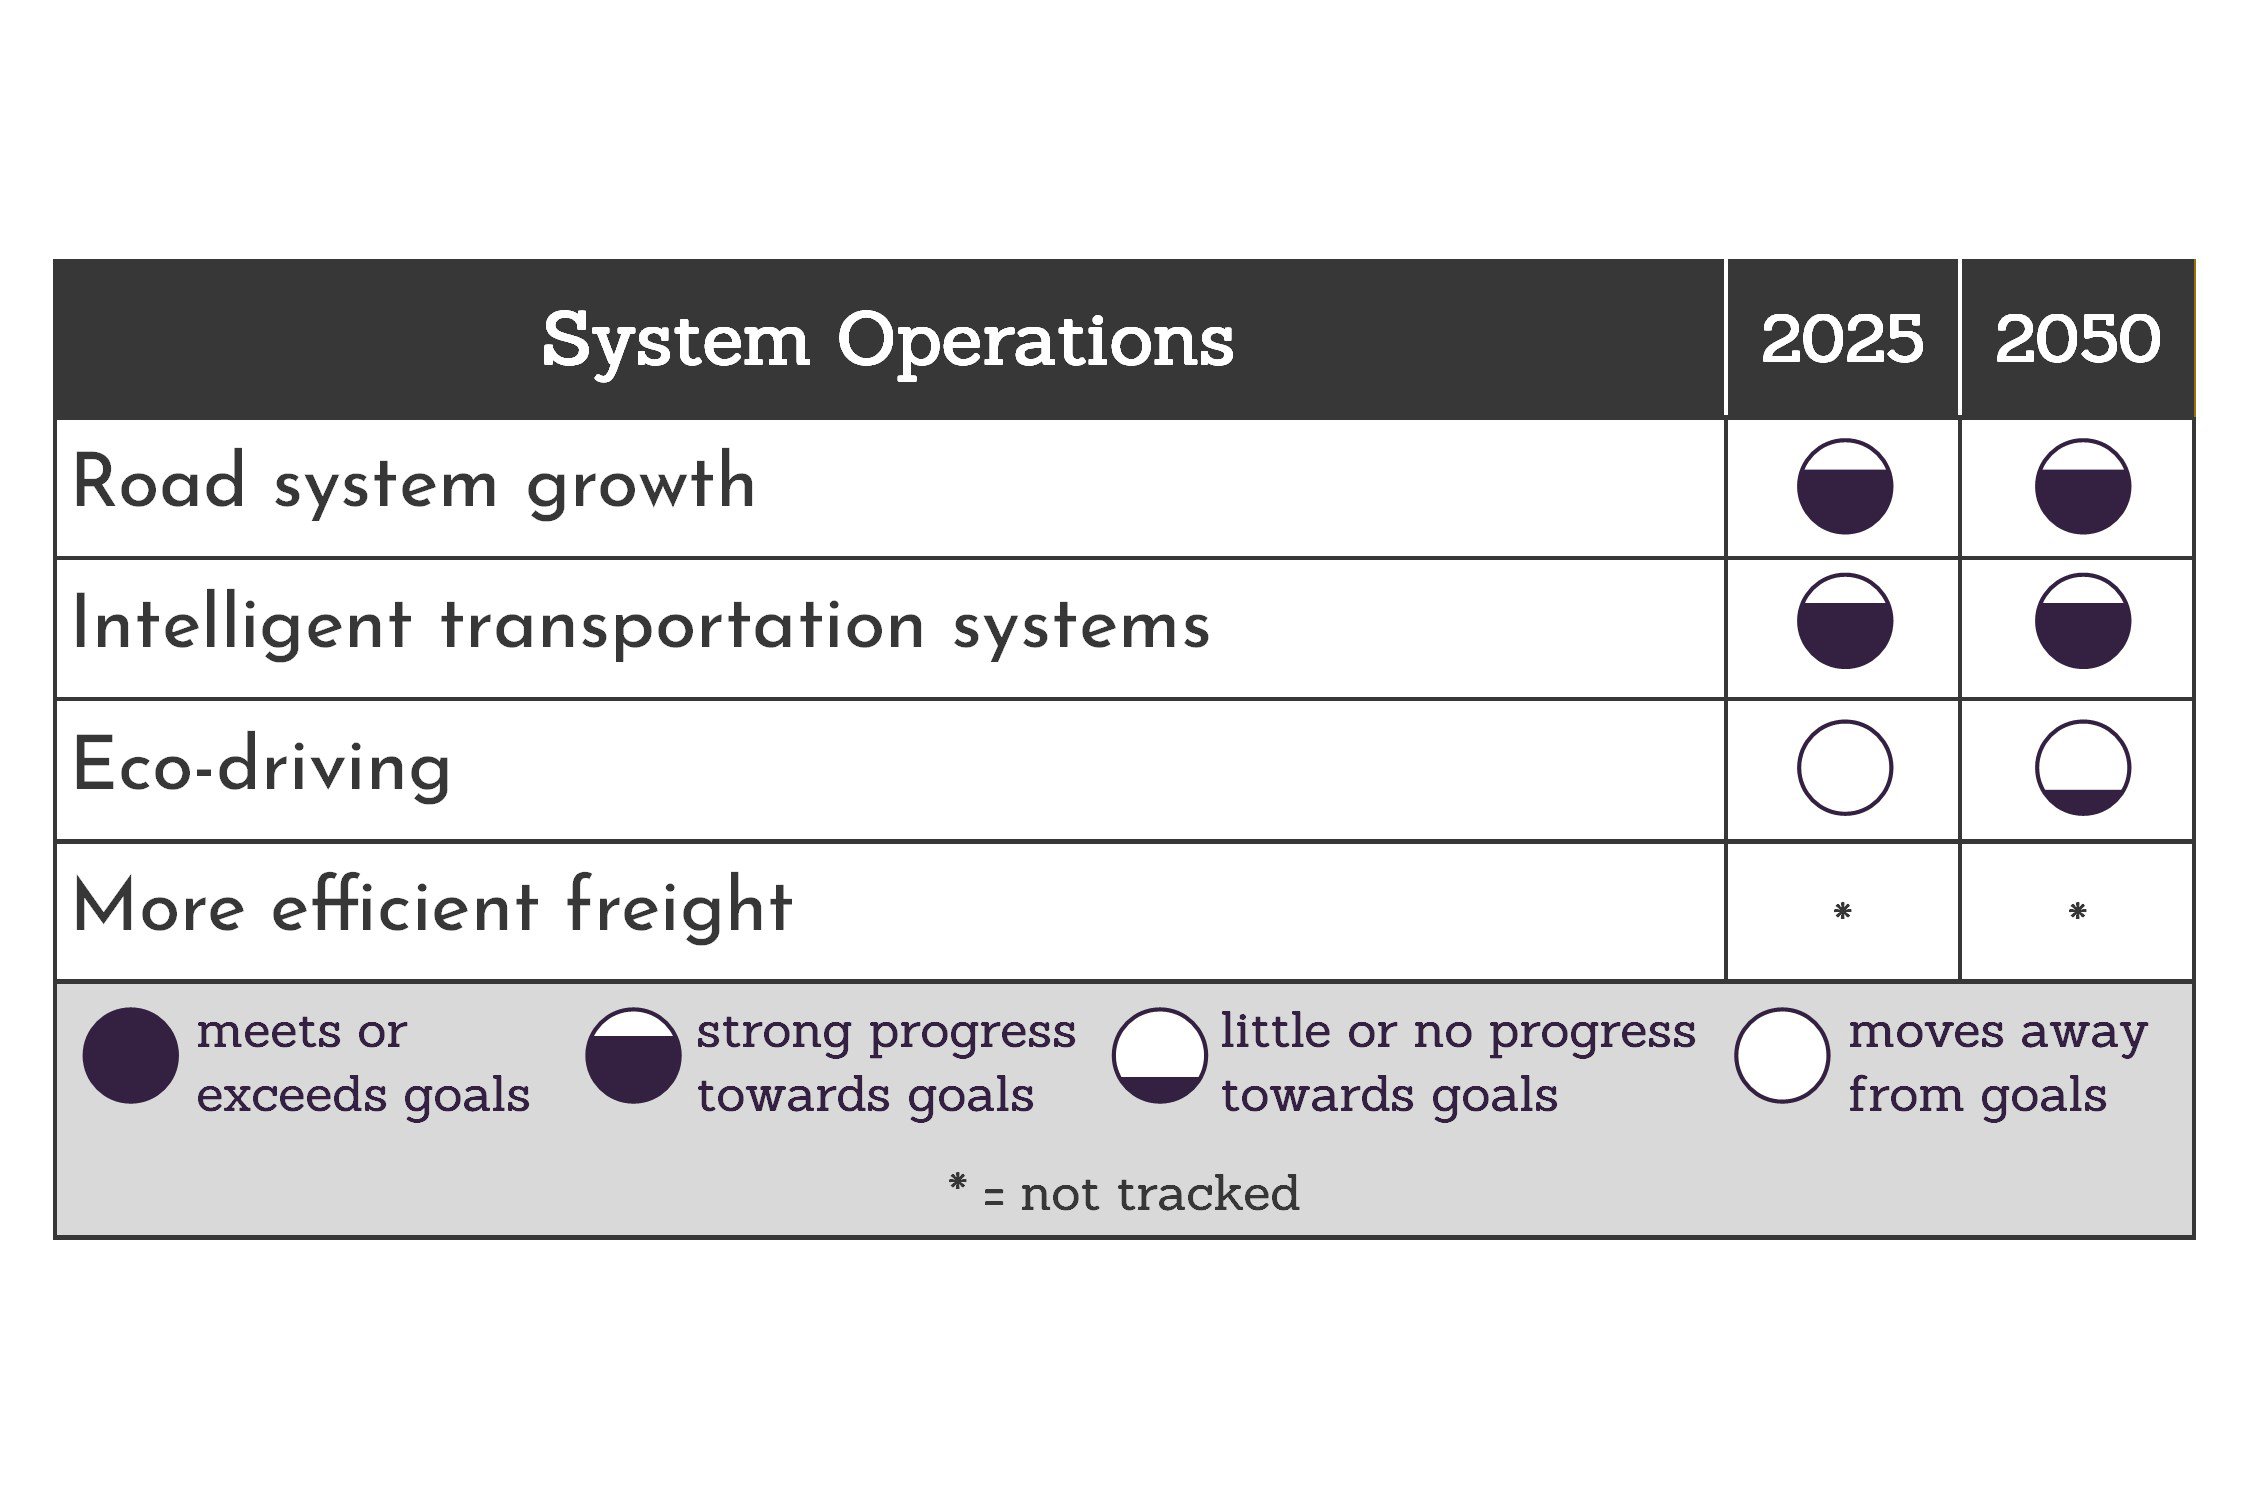
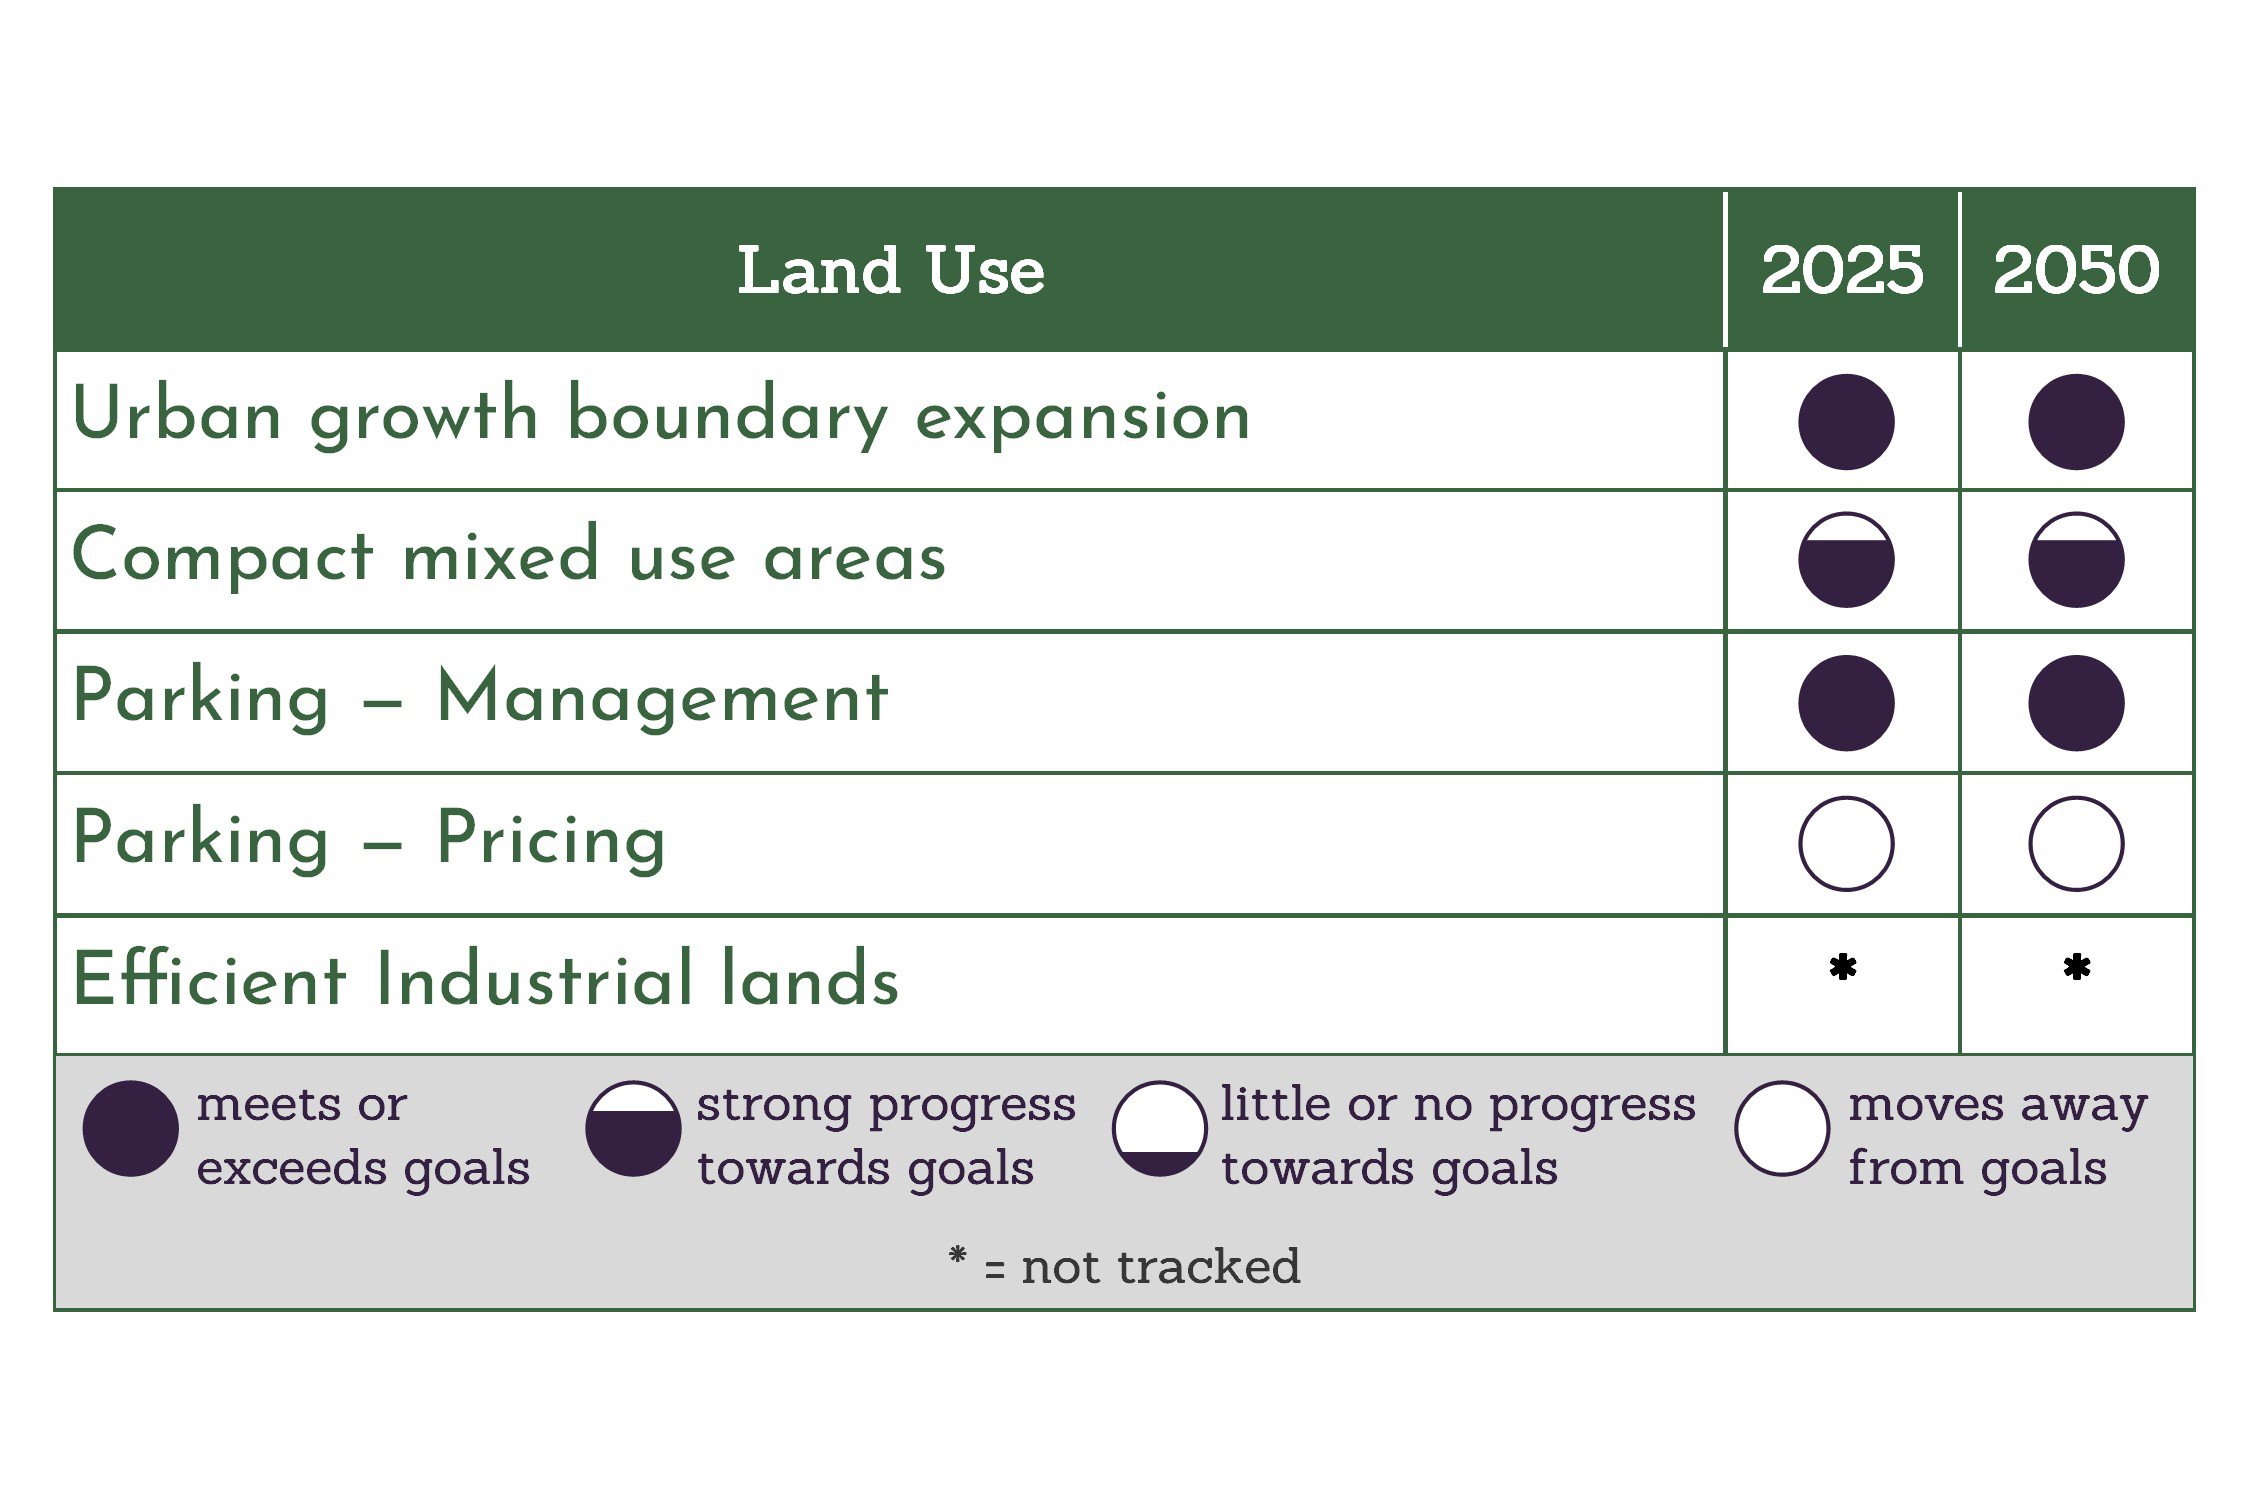
Category progress
The state is tracking progress in six transportation categories. Each category has several actions. In 2022, the state published a category progress report.
Learn more about progress in each category:
Visit the About page to learn how the categories fit in with the 2050 goal and objectives.
How the data is collected, and how it’s used to track progress
Forecasting looks to the future and helps set long-term goals. State agencies use gathered data to build models that help them envision where Oregon could be in the future. As time goes on, agencies gather and measure more data, and their methods and measurement tools improve. This translates to more accurate forecasting models.
Measurements and forecasting work together to help Oregon set targets for future outcomes. State agencies measure against those targets at regular intervals to see how they’re doing, and make necessary adjustments when needed. ODOT and partners followed this measurement and forecast approach in 2018 and 2022 to create the emissions progress charts on this webpage.
Sharing data with the public is the final step. That’s why this website exists; transparency on the emissions reduction work presented in an easy-to-understand format.
If you would like a deeper dive into the data used to measure and forecast progress on this website, please email the ODOT Climate Office: climate.office@odot.oregon.gov.
Data are gathered from federal, state and local governments and commercial sources. State agencies have been tracking some data for decades, while other data points are relatively new. Industry partners and nonprofits can provide valuable data resources, too.
The key to understanding how state agencies use data to track Oregon’s progress is knowing the distinction between “measurement” and “forecasting.”
Measurements are used to establish baselines and identify trends over time. Some things can be easier to measure directly — like the number of registered electric vehicles each year — while others are more difficult, like the amount of greenhouse gas emissions emitted in a particular scenario.
For measurements that are harder to measure directly, state agencies gather other data to help them make accurate estimates. This includes data like vehicle miles traveled, vehicle registration counts, fuel costs, what type of means people use to travel, EV charging infrastructure availability, public parking costs, and others.
Once the measurement data are collected, state agencies can use them for forecasting.
How ODOT forecasts emissions
ODOT uses (and helped create) a tool called VisionEval to forecast Oregon greenhouse gas emissions from transportation. VisionEval is a long-range strategic planning tool. It forecasts how community development and transportation investment choices could influence planning goals, land use goals, and other community livability outcomes.
Learn more about how VisionEval works on this two-page PDF.
ODOT leads the VisionEval forecast process and relies on expert review and input from partner agencies at the local and state level to produce the best forecasts, given future uncertainties.
