
Global Temperatures
The year 2019 was the second warmest year in the 140-year record, with a global land and ocean surface temperature departure from average of +0.95°C (+1.71°F). This value is only 0.04°C (0.07°F) less than the record high value of +0.99°C (+1.78°F) set in 2016 and 0.02°C (0.04°F) higher than the now third highest value set in 2015 (+0.93°C / +1.67°F). The five warmest years in the 1880–2019 record have all occurred since 2015, while nine of the 10 warmest years have occurred since 2005. The year 1998 currently ranks as the 10 warmest year on record. The year 2019 marks the 43rd consecutive year (since 1977) with global land and ocean temperatures, at least nominally, above the 20th century average.
The year began in a weak-to-moderate El Niño, transitioning to ENSO-neutral conditions by July. During the year, each monthly temperature ranked among the five warmest for their respective months on record, with the months of June and July record warm.
The global annual temperature has increased at an average rate of 0.07°C (0.13°F) per decade since 1880 and over twice that rate (+0.18°C / +0.32°F) since 1981.
| January–December | Anomaly | Rank (out of 140 years) | Records | ||||
|---|---|---|---|---|---|---|---|
| °C | °F | Year(s) | °C | °F | |||
| Global | |||||||
| Land | +1.42 ± 0.14 | +2.56 ± 0.25 | Warmest | 2nd | 2016 | +1.54 | +2.77 |
| Coolest | 139th | 1884 | -0.72 | -1.30 | |||
| Ties: 2015 | |||||||
| Ocean | +0.77 ± 0.16 | +1.39 ± 0.29 | Warmest | 2nd | 2016 | +0.79 | +1.42 |
| Coolest | 139th | 1904 | -0.46 | -0.83 | |||
| Land and Ocean | +0.95 ± 0.15 | +1.71 ± 0.27 | Warmest | 2nd | 2016 | +0.99 | +1.78 |
| Coolest | 139th | 1904 | -0.45 | -0.81 | |||
| Northern Hemisphere | |||||||
| Land | +1.46 ± 0.16 | +2.63 ± 0.29 | Warmest | 4th | 2016 | +1.68 | +3.02 |
| Coolest | 137th | 1884 | -0.82 | -1.48 | |||
| Ocean | +0.95 ± 0.16 | +1.71 ± 0.29 | Warmest | 1st | 2019 | +0.95 | +1.71 |
| Coolest | 140th | 1904 | -0.52 | -0.94 | |||
| Land and Ocean | +1.15 ± 0.15 | +2.07 ± 0.27 | Warmest | 2nd | 2016 | +1.21 | +2.18 |
| Coolest | 139th | 1904, 1907 | -0.48 | -0.86 | |||
| Southern Hemisphere | |||||||
| Land | +1.32 ± 0.11 | +2.38 ± 0.20 | Warmest | 1st | 2019 | +1.32 | +2.38 |
| Coolest | 140th | 1917 | -0.72 | -1.30 | |||
| Ocean | +0.64 ± 0.16 | +1.15 ± 0.29 | Warmest | 2nd | 2016 | +0.70 | +1.26 |
| Coolest | 139th | 1909, 1911 | -0.43 | -0.77 | |||
| Land and Ocean | +0.74 ± 0.15 | +1.33 ± 0.27 | Warmest | 2nd | 2016 | +0.77 | +1.39 |
| Coolest | 139th | 1911 | -0.44 | -0.79 | |||
| Arctic | |||||||
| Land and Ocean | +2.14 ± 0.14 | +3.85 ± 0.25 | Warmest | 2nd | 2016 | +2.35 | +4.23 |
| Coolest | 139th | 1902 | -1.44 | -2.59 | |||
The 1901–2000 average combined land and ocean annual temperature is 13.9°C (57.0°F), the annually averaged land temperature for the same period is 8.5°C (47.3°F), and the long-term annually averaged sea surface temperature is 16.1°C (60.9°F).
Ten Warmest Years (1880–2019)
The following table lists the global combined land and ocean annually averaged temperature rank and anomaly for each of the 10 warmest years on record.
| Rank 1 = Warmest Period of Record: 1880–2019 |
Year | Anomaly °C | Anomaly °F |
|---|---|---|---|
| 1 | 2016 | 0.99 | 1.78 |
| 2 | 2019 | 0.95 | 1.71 |
| 3 | 2015 | 0.93 | 1.67 |
| 4 | 2017 | 0.91 | 1.64 |
| 5 | 2018 | 0.83 | 1.49 |
| 6 | 2014 | 0.74 | 1.33 |
| 7 | 2010 | 0.72 | 1.30 |
| 8 (tied) | 2005 | 0.67 | 1.21 |
| 8 (tied) | 2013 | 0.67 | 1.21 |
| 10 | 1998 | 0.65 | 1.17 |
Regional Temperatures
The following information was compiled from previous NCEI monitoring reports and public reports by National Hydrometeorological Services (NHMSs; peers of the U.S. National Weather Service).
The year 2019 was characterized by warmer-than-average conditions across most of the global land and ocean surfaces. Record high annual temperatures over land surfaces were measured across parts of central Europe, Asia, Australia, southern Africa, Madagascar, New Zealand, North America, and eastern South America. Record high sea surface temperatures were observed across parts of all oceans, specifically, parts of the North and South Atlantic Ocean, the western Indian Ocean, and areas of northern, central and southwestern Pacific Ocean. No land or ocean areas were record cold for the year.


North America
North America was the only continent that did not have an annual temperature that ranked among its three highest on record. Overall, North America's temperature was 0.90°C (1.62°F) above the 1910–2000 average, marking the 14th warmest year in the 110-year continental record. The yearly temperature for North America has increased at an average rate of 0.13°C (0.23°F) per decade since 1910; however, the average rate of increase is more than twice as great (+0.29°C / +0.52°F per decade) since 1981.
- During January 2019, several locations across Canada set new low maximum and minimum January temperature records at the end of the month as cold Arctic air affected the region. According to Environment and Climate Change Canada, maximum temperatures during this time did not rise above the -25.0°C (-13.0°F) mark. Of note, Lansdowne House (Ontario) set a new low minimum temperature on January 27 when temperatures plummeted to -47.5°C (-53.5°F), exceeding the previous record set in 1957 (-38.9°C / -38.0°F).
- Please see the U.S. national annual report for information on the 2019 climate conditions across the U.S.
- According to Mexico's CONAGUA, the months of June through November (no December 2019 data was available at the time of this write-up) had a temperature that ranked among the four highest for their respective months. Of note, August 2019 was the warmest August on record for the nation with a temperature departure from average of +3.3°C (+5.9°F). The national temperature for the months of March and May were among the ten warmest for their respective months on record.
South America
South America had its second warmest year on record with a temperature departure from average of +1.24°C (+2.23°F). This value is only 0.19°C (0.34°F) cooler than the record-warm year in 2015. South America's five warmest years on record have all occurred since 2014. The yearly temperature for South America has increased at an average rate of 0.13°C (0.23°F) per decade since 1910; however, the average rate of increase is nearly double that value (+0.24°C / +0.43°F per decade) since 1981.
- Argentina's national temperature for the year was 0.3°C (0.5°F) above the 1981–2010 average and ranked as the 12th highest temperature since national records began in 1961. Argentina's five warmest years have all occurred since 2012
- A heat wave impacted much of Chile during January 24–27, 2019, with several locations registering temperatures as high as 40.0°C (104.0°F). The city of Santiago set a new maximum temperature record when temperatures soared to 38.3°C (100.9°F) on January 27. Santiago's previous record was set in 2017 at 37.4°C (99.3°F).
- According to the World Meteorological Organization, Brazil also had a heat wave that affected the southeastern part of the country during January 2019. Several locations recorded temperatures above 30.0°C (86.0°F). Of particular interest, Rio de Janeiro had registered a temperature of 37.4°C (99.3°F)—the second hottest temperature for the station since 1961.
Europe
Following Europe's record warm year in 2018, the year 2019 was also very warm, ranking as the second warmest on record and just 0.04°C (0.07°F) cooler than 2018. The years 2014 through 2019 all rank among Europe's six warmest years on record. Europe's annual temperature has increased at an average rate of 0.14°C (0.25°F) per decade since 1910; however, it has more than tripled to 0.46°C (0.83°F) since 1981.
- Warmer-than-average conditions were present across much of western and central Europe during late February, with several locations setting new February maximum temperature records. For the first time, the United Kingdom recorded a maximum temperature over 20.0°C (68.0°F) during a winter month. The maximum temperature of 21.2°C (70.2°F) was set on February 26, 2019 at Kew Gardens, London. A new Swedish maximum temperature for February was set on the 26th when temperatures rose to 16.7°C (62.1°F) in Karlshamn. This value surpassed the previous record of 16.5°C (61.7°F) set in Ölvingstorp and Västervik, Smaland on February 18, 1961. The Netherlands observed its highest February maximum temperature since national records began in 1901. On February 26, 2019, maximum temperatures reached 18.9°C (66.0°F) in De Bilt. Austria set a new national maximum temperature record on February 28, 2019 when temperatures soared to 24.2°C (75.6°F) in Güssing and Deutschlandsberg. This value exceeded the previous record set on February 29, 1960 by 0.6°C (1.1°F).
- According to Météo France, nine of 12 months in 2019 were warmer than average in France, with only May experiencing cooler-than-average temperatures. Overall, this was France's third warmest year since national records began in 1900 at 1.1°C (2.0°F) above the 1981–2010 average of 12.6°C (54.7°F). Only 2018 (+1.4°C / +2.5°F) and 2014 (+1.2°C / +2.2°F) were warmer. Nine of France's 10 warmest years on record have all occurred since 2000; with the five warmest years taking place since 2011. During 2019, France was affected by two severe heat waves during June and July, which resulted in a new national high maximum temperature being set in southern France on June 28, 2019 at 46.0°C (114.8°F). This value was 1.9°C (3.4°F) higher than the previous record and marked the first time maximum temperatures surpassed 45.0°C (113.0°F) in the country.
- Austria had its third warmest year since national records began in 1767, with a national temperature departure from average of +1.6°C (+2.9°F). Only the years of 2018 and 2014 were warmer. According to Austria's ZAMG, the 14 warmest years on record have all occurred since 1994.
- According to the World Meteorological Organization (WMO), Belgium, Germany, Luxembourg, the Netherlands, and the United Kingdom set new national July temperature records. Germany's temperature of 42.6°C (108.7°F) on July 25 became the new national temperature record for July, breaking the previous record of 40.3°C (104.5°F) set on July 5, 2015 by 2.3°C (4.1°F). The Netherlands' new national all-time maximum temperature of 40.7°C (105.3°F) set on July 25 in Gilze-Rijen surpassed a 75-year-old record of 38.8°C (101.8°F) set on August 23, 1944 by 0.5°C (0.9°F). This marked the first time that temperatures exceeded 40.0°C (104.0°F) in The Netherlands. Norway recorded a maximum temperature of 35.6°C (96.1°F) at Laksfors, tying the national maximum temperature record set on June 20, 1970 at Nesbyen (Buskerud). Saltdal recorded a maximum temperature of 34.6°C (94.3°F)—the highest temperature ever recorded north of the Arctic Circle in Norway, according to Météo France. Similarly, Sweden had a maximum temperature of 34.8°C (94.6°F) in the Markusvinsa on July 26—the nation's highest temperature on record north of the Arctic Circle.
Africa
With a yearly continental average temperature of 1.33°C (2.39°F) above average, Africa had its third warmest year in the 110-year record, trailing behind 2016 (warmest) and 2010 (second warmest). Africa's five warmest years have all occurred since 2015. Africa's annual temperature has increased at an average rate of 0.12°C (0.22°F) per decade since 1910; however, it has more than doubled to 0.31°C (0.56°F) since 1981.
Asia
Asia had its third warmest year on record, with a temperature of 1.68°C (3.02°F) above the 1910–2000 average. Only the years 2015 and 2017 were warmer. Asia's five warmest years have all taken place since 2007. Asia's trend during the 1910–2019 period was +0.16°C (+0.29°F) per decade; however, the 1981–2019 trend is twice the longer-term trend (+0.35°C / +0.63°F).
- Hong Kong had its warmest year, with the highest maximum (27.1°C / 80.8°F), minimum (22.6°C / 72.7°F), and mean (24.5°C / 76.1°F) temperatures since records began in 1884.
- According to Japan's Meteorological Agency, Japan set a new May national maximum temperature record when temperatures soared to 39.5°C (103.1°F) on May 26, 2019 in Saroma (located on the island of Hokkaido). This value surpassed the previous May record of 37.2°C (99.0°F), set in May 1993, by 2.3°C (4.14°F). Thirty-six stations across Japan set new all-time maximum temperature records. Of note, the station in Obihiro set a new all-time high temperature of 38.8°C (101.8°F), exceeding the previous record of July 12, 1924 by 1.0°C (1.8°F).
- Israel experienced a heat wave that brought record-breaking temperatures during May 22–24. Several locations saw temperatures soar to between 43.0°–45.0°C (109°–113°F). According to Israel's Meteorological Services, the most intense heat was observed on the 24th when maximum temperatures rose to 45°–48°C (113.0°–118.0°F) in the Jordan Valley, the Dead Sea area, and northern Arava. According to the World Meteorological Organization, Sedom, Israel, had a maximum temperature of 49.9°C (121.8°F) on July 17, Israel's highest temperature since at least 1942.
Oceania
Oceania had its warmest year on record at 1.40°C (2.52°F) above average. This value is 0.04°C (0.07°F) warmer than the now second warmest year on record set in 2013. Oceania's five warmest year have all occurred since 2005. The 1910–2019 trend for Oceania was +0.12°C (+0.22°F) per decade; however, the trend is twice that during the 1981–2018 period (+0.22°C / +0.40°F per decade).
- Australia had its warmest year in the nation's 110-year record with a temperature departure from average of 1.52°C (2.74°F) above the 1961–1990 average. This exceeded the previous record of 1.33°C (2.39°F) set in 2013 by 0.19°C (0.34°F). The nation's maximum temperature was also the highest on record at 2.09°C (3.76°F) above average, while the minimum temperature (+0.95°C / +1.71°F) was the sixth highest on record. An intense heat wave affected Australia throughout much of January, with many locations setting new high maximum and minimum January temperature records. According to Australia's Bureau of Meteorology, the nation's mean temperature reached 40.0°C (104.0°F) for five consecutive days (12–16 January 2019), exceeding the previous record of two consecutive days set in 1972 and again in 2013.
- New Zealand had its fourth warmest year on record with a national average temperature of 13.37°C (56.07°F). This was 0.76°C (1.37°F) above the 1981–2010 average. Only the years of 2016 (warmest) and 2018 and 1998 (tied second warmest) were warmer.
Precipitation
As indicated by the Global Percent of Normal Precipitation and Precipitation Percentiles maps below and as is typical, many stations were wet for the year, while many stations were dry. Also, as discussed below, extreme precipitation and drought events occurred across the world.


North America
- See the U.S. National Annual Climate and U.S. Annual Drought reports for additional information on drought and notable precipitation extremes across the U.S. during 2019.
- Hurricane Dorian affected the U.S. Virgin Islands and Puerto Rico in late August with 75 mph (121 km h-1) winds and heavy rain, then intensified to a Category 5 hurricane. Dorian made landfall in the Bahamas on September 1, making it the strongest hurricane on record to affect the Bahamas on record. Dorian remained stationary over the Bahamas for about 24 hours, causing great devastation across the islands. Estimated economic losses exceed $3 billion (U.S. dollars).
South America
- Parts of northern Argentina and southern Brazil had above-average precipitation totals during January 2019. Several locations set new precipitation records for January. Of note, the city of Resistencia had a total of 556.8 mm (21.9 inches). The city of Resistencia also set a new January 24-hour rainfall record when a total of 224 mm (8.8 inches) fell on January 8. The previous record of 206 mm (8.1 inches) was set in 1994.
- Heavy rain fell across parts of Argentina's Santiago del Estero Province, located in northern Argentina, in early May. The torrential rain prompted floods that damaged nearly 600,000 hectares of crops and about 700 people were forced to evacuate their homes.
Europe
- Spain had its wettest April since 2008 and the fourth wettest since national records began in 1965 at 96 mm (3.8 inches) or 48% above the 1981–2010 average of 65 mm (2.6 inches). Several locations in southeastern Spain set new daily and monthly precipitation records. Of note, the Alicante-Elche Airport received a total of 98.9 mm (3.9 inches) on April 15, 2019, surpassing the previous record of 38 mm (1.5 inches) set in April 15, 2004. The Alicante-Elche Airport also set a new monthly precipitation record with a total of 186 mm (7.3 inches).
- Drier-than-average conditions were present across much of Finland, with some locations having their driest April on record. Pello had a total of 3.6 mm (0.14 inch) for th month—the lowest precipitation total in April since records began for this location 50 years ago. The dry and warm conditions contributed to the development of wildfires in southern Finland at the end of the month.
- Summer 2019 was particularly dry across parts of western and central Europe. According to the WMO, Paris, France had a total of 34 consecutive days (August 19–September 21) without rain—tying its second longest dry spell on record.
Africa
- Tropical cyclone Idai, which formed in the Mozambique Channel on March 4, reached its maximum sustained winds of 127 mph (205 km h-1) on March 14, equivalent to a Category 3 tropical cyclone on the Saffir-Simpson hurricane wind scale. However, it decreased in intensity to an equivalent Category 2 tropical cyclone before making landfall in central Mozambique on March 15. During Idai's lifespan, the storm brought strong winds and torrential rains to Madagascar, Mozambique, Malawi, and Zimbabwe. Over 3 million people in eastern Africa were affected and over 1070 people died due to the severe weather conditions. Idai was one of the strongest known cyclones to make landfall on the east coast of Africa (WMO) and, according to reports, was the second deadliest tropical cyclone in the South-west Indian Ocean basin, behind an unnamed tropical cyclone in 1892 (1200 fatalities). Total damages caused by the storm are estimated to be at least $1 billion (U.S. dollars)—one of the costliest tropical cyclones in the South-west Indian Ocean basin.
- Tropical Cyclone Kenneth made landfall in northern Mozambique on April 25 as an equivalent Category 4 hurricane on the Saffir-Simpson scale. The storm was the second tropical cyclone to impact Mozambique within weeks of each other (Tropical Cyclone Idai). According to the World Meteorological Organization (WMO), this was the first time that two major (equivalent to Category 3 or higher on the Saffir-Simpson scale) tropical cyclones made landfall in Mozambique in the same season. Kenneth was also the first tropical cyclone to impact northern Mozambique, an area where no storms have previously been observed since satellite records began. According to the WMO, the northern city of Pemba had a total of 168.7 mm (6.6 inches) of rain in a 24-hour period from April 27–28, with an additional 254.7 mm (10.0 inches) from April 28–29. The heavy rainfall across northern Mozambique led to severe floods and landslides. The South-west Indian Ocean 2018/19 tied with the record season of 1993/94.
Asia
- According to the WMO, rainfall during India's summer monsoon season (June–September) for 2019 was 10% above the 1961–2010 average, marking the wettest summer monsoon season since 1994 and the first time it was above-average since 2013.
- According to Germany's Deutscher Wetterdienst, copious rain impacted Israel and Jordan on February 27–28 . The cities of Jerusalem and Amman recorded more than one month's worth of rain in just 24 hours. The heavy rain triggered floods, caused traffic disruptions, and prompted evacuations.
- Typhoon Wutip was the Northern Hemisphere's first February Category 5 typhoon on record. Wutip produced significant rainfall over parts of Micronesia.
- Western Iran had unprecedented rainfall during March 17–31, setting new daily precipitation records at eight stations. Of note, the Koohrang station in the Chahar Mahal-Bakhtiari province had a total daily rainfall of 187.8 mm (7.4 inches). According to the Islamic Republic of Iran Meteorological Organization, 28% of the nation's annual rainfall total was received during the last two weeks of March. Several provinces in western Iran received 30–60% of their annual total during this time. The heavy rain led to floods in the region and over 70 fatalities were directly or indirectly related to the severe weather conditions.
- The Bahrain International Airport in the Kingdom of Bahrain had a total of six rainy days during April 2019, resulting in a monthly total precipitation of 31.3 mm (1.23 inches). This was more than three times the April normal of 10.0 mm (0.39 inch) and was the fifth highest April precipitation total since records began in 1902. The wettest April took place in 1961 with a total of 69.9 mm (2.75 inches).
- Parts of southeast Asia were affected by drought conditions during 2019. It was reported that Singapore had its driest July–September on record.
- Typhoon Hagibis made landfall in Japan's Izu peninsula on October 12, impacting the nation with strong winds and record-breaking rainfall. The storm also brought damaging storm surge and caused coastal and inland flooding. According to the WMO, Hakone-machi (located in southwestern Kanagawa) had a daily total of 922.5 mm (36.19 inches) of rain due to Hagibis, which was the highest daily total in Japan on record. Hagibis was also one of the most rapidly intensifying tropical cyclones on record in the region and one of the highest-impact storms to affect Japan in many years.
Oceania
- With an average of only 277.6 mm (10.9 inches) of precipitation during 2019, Australia had its driest year on record in the 120-year precipitation record. This was 36.9 mm (1.4 inches) of precipitation less than the now second driest year of 1902. A very strong positive Indian Ocean Dipole was a contributing factor to the much drier conditions during 2019. Record warm and dry conditions throughout much of the year also contributed to the development of significant wildfires. Smoke and dust from the wildfires reduced air quality across eastern Australia. According to Australia's Bureau of Meteorology, the frequency of extreme heat events have increased about five fold since the 1950s in Australia.
- In New Zealand, several locations had dry conditions in February 2019, persisting from late January. The city of Nelson on the South Island had a 40-day dry spell (15 days or more with less than 1 mm [0.04 inch] of rain on any one day)—its fourth longest dry spell since records began in 1862. Tauranga and Hamilton had a 36-day dry spell, which was their third longest since records began in 1910 and 1935, respectively.
- New Zealand set a new national 48-hour precipitation record when a total of 1086 mm (42.75 inches) of rain fell at Cropp River (located in New Zealand's South Island) in late March.
Ocean Heat Content
Ocean Heat Content (OHC) is essential for understanding and modeling global climate since > 90% of excess heat in the Earth's system is absorbed by the ocean. Further, expansion due to increased ocean heat contributes to sea level rise. Change in OHC is calculated from the difference of observed temperature profiles from the long-term mean.
| Basin | 0-700 meters | Rank (1955-2019) | |||||
|---|---|---|---|---|---|---|
| Entire Basin | Northern Hemisphere | Southern Hemisphere | ||||
| Atlantic | 7.503 | 1st | 4.224 | 1st | 3.279 | 1st |
| Indian | 3.534 | 4th | 0.708 | 3rd | 2.826 | 5th |
| Pacific | 6.684 | 1st | 3.252 | 2nd | 3.432 | 3rd |
| World | 17.726 | 1st | 8.188 | 1st | 9.537 | 1st |
| Source: Basin time series of heat content | ||||||
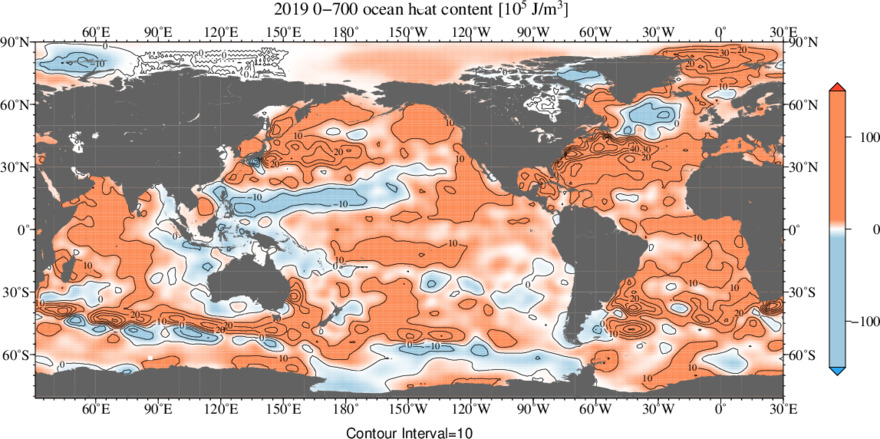

Ocean heat content (OHC), for the upper 2000 meters, for 2019 was the highest in the 70-year record at 228 ZJ (Zeta Joules; 1 ZJ = 1021 Joules) above the 1981–2010 average. The 2019 OHC bested the previous record set in 2018 by 25 ZJ. The five highest OHC have all occurred in the last five years (2015–19), while the last ten years (2010–19) have the 10 highest OHC on record. During 2019, the heating was distributed throughout the world's oceans, with the vast majority of regions showing an increase in thermal energy. The Atlantic Ocean and Southern Oceans (especially near Antarctic Circumpolar Current, ACC, (40°S–60°S) continued to show a larger warming compared to most of the other basins.
The ocean heating is irrefutable and a key measure of the Earth's energy imbalance: the excess greenhouse gases in the air trap more heat inside the climate system and drives global warming. More than 90% of the heat accumulates in the ocean because of its large heat capacity, and the other heating is manifested in warming the atmosphere, warming and drying land, and melting land and sea ice. There are no reasonable alternatives aside from the human emissions of heat-trapping gases (IPCC 2001, 2007, 2013, 2019; USGCRP 2017).
For additional information on the 2019 OHC, please see the paper titled Record-Setting Ocean Warmth Continued in 2019.
References
- Menne, M. J., C. N. Williams, B.E. Gleason, J. J Rennie, and J. H. Lawrimore, 2018: The Global Historical Climatology Network Monthly Temperature Dataset, Version 4. J. Climate, in press. https://doi.org/10.1175/JCLI-D-18-0094.1.
- Huang, B., Peter W. Thorne, et. al, 2017: Extended Reconstructed Sea Surface Temperature version 5 (ERSSTv5), Upgrades, validations, and intercomparisons. J. Climate, doi: 10.1175/JCLI-D-16-0836.1
- Peterson, T.C. and R.S. Vose, 1997: An Overview of the Global Historical Climatology Network Database. Bull. Amer. Meteorol. Soc., 78, 2837-2849.
- Huang, B., V.F. Banzon, E. Freeman, J. Lawrimore, W. Liu, T.C. Peterson, T.M. Smith, P.W. Thorne, S.D. Woodruff, and H-M. Zhang, 2016: Extended Reconstructed Sea Surface Temperature Version 4 (ERSST.v4). Part I: Upgrades and Intercomparisons. J. Climate, 28, 911-930.