Improved Wetland Soil Organic Carbon Stocks of the Conterminous U.S. Through Data Harmonization
 Bergit Uhran1*†
  Lisamarie Windham-Myers2†
  Norman Bliss3† Amanda M. Nahlik4† Eric T. Sundquist5*† Camille L. Stagg6†
- 1United States Geological Survey (USGS), Florence Bascom Geoscience Center, Reston, VA, United States
- 2United States Geological Survey (USGS), Water Mission Area, Menlo Park, CA, United States
- 3Volunteer, United States Geological Survey (USGS) Earth Resources Observation and Science Center, Sioux Falls, SD, United States
- 4United States Environmental Protection Agency, Office of Research and Development, Center for Public Health and Environmental Assessment, Pacific Ecological Systems Division, Corvallis, OR, United States
- 5United States Geological Survey (USGS), Florence Bascom Geoscience Center, Woods Hole, MA, United States
- 6United States Geological Survey (USGS), Wetland and Aquatic Research Center, Lafayette, LA, United States
Wetland soil stocks are important global repositories of carbon (C) but are difficult to quantify and model due to varying sampling protocols, and geomorphic/spatio-temporal discontinuity. Merging scales of soil-survey spatial extents with wetland-specific point-based data offers an explicit, empirical and updatable improvement for regional and continental scale soil C stock assessments. Agency-collected and community-contributed soil datasets were compared for representativeness and bias, with the goal of producing a harmonized national map of wetland soil C stocks with error quantification for wetland areas of the conterminous United States (CONUS) identified by the USGS National Landcover Change Dataset. This allowed an empirical predictive model of SOC density to be applied across the entire CONUS using relational %OC distribution alone. A broken-stick quantile-regression model identified %OC with its relatively high analytical confidence as a key predictor of SOC density in soil segments; soils <6% OC (hereafter, mineral wetland soils, 85% of the dataset) had a strong linear relationship of %OC to SOC density (RMSE = 0.0059, ~4% mean RMSE) and soils >6% OC (organic wetland soils, 15% of the dataset) had virtually no predictive relationship of %OC to SOC density (RMSE = 0.0348 g C cm−3, ~56% mean RMSE). Disaggregation by vegetation type or region did not alter the breakpoint significantly (6% OC) and did not improve model accuracies for inland and tidal wetlands. Similarly, SOC stocks in tidal wetlands were related to %OC, but without a mappable product for disaggregation to improve accuracy by soil class, region or depth. Our layered harmonized CONUS wetland soil maps revised wetland SOC stock estimates downward by 24% (9.5 vs. 12.5Pg C) with the overestimation being entirely an issue of inland organic wetland soils (35% lower than SSURGO-derived SOC stocks). Further, SSURGO underestimated soil carbon stocks at depth, as modeled wetland SOC stocks for organic-rich soils showed significant preservation downcore in the NWCA dataset (<3% loss between 0 and 30 cm and 30 and 100 cm depths) in contrast to mineral-rich soils (37% downcore stock loss). Future CONUS wetland soil C assessments will benefit from focused attention on improved organic wetland soil measurements, land history, and spatial representativeness.
Introduction
Wetland soils represent approximately one third of soil organic carbon (SOC) stored globally [~500 Pg C, (1)], and thus one quarter of total carbon stored in terrestrial ecosystems, despite covering only 3% of global land area (~5–10 M km2). Documentation of wetland soil carbon stocks is important for global carbon cycling projections, especially given the potential for wetland loss (2). Approximately 53% of the original wetland area of the conterminous US (CONUS) has been lost due to agricultural drainage, urban and industrial development, environmental degradation, etc. (3, 4). Carbon dioxide, methane, and nitrous oxide can be significant contributors to greenhouse gas emissions from wetlands (5) especially from disturbances that liberate previously stabilized carbon e.g. (6–10).
Despite the importance and vulnerability of terrestrial wetland carbon as a resource, confidence in wetland SOC profiles and stocks remains low due to inconsistencies among data quality and representativeness. For example, in the comprehensive Second State of the Carbon Cycle Report (11, 12) CONUS estimates of wetland soil carbon stocks range from 8.9 to 14.1 Pg respectively e.g. (13–15). Herein, we assess the distributions and uncertainties in national scale-products to produce a harmonized CONUS map of wetland SOC stocks. We do this using percent organic carbon by weight (%OC) alone, because it is a widely measured, analytically confident parameter with strong predictive value for a large majority of soil samples e.g. (16).
Understanding the distribution of SOC density among wetland types and across soil depths provides a framework to assess SOC vulnerability to disturbances. Many CONUS field-based datasets are available, including federally funded collections (e.g., U.S. Department of Agriculture's National Cooperative Soil Survey (NCSS) Soil Survey Geographic Database (SSURGO), U.S. Environmental Protection Agency (EPA) National Wetland Condition Assessment (NWCA), U.S. Forest Service Forest Inventory and Analysis (USFS FIA), National Science Foundation (NSF) National Ecological Observatory Network (NEON), and scientific community-contributed data [e.g., NSF Coastal Carbon Research Coordination Network (CCRCN), International Soil Carbon Network (ISCN)]. Each has strengths and weaknesses regarding sampling regime, soil depth profile, analytes, metadata, and representativeness (17), and there can be substantial disagreements when comparing soil data across cores and survey databases e.g. (18, 19), including methodology and purpose e.g. (20), assumptions made when imputing continuous spatial distributions from individual samples or layers [e.g., gSSURGO and Soilgrids 250 m, (21)], and sampling strategies and measurement representativeness for upscaling (22). Overestimated bulk density is a common bias among global organic soil measurements, especially in wetlands (23). While dry bulk density measurements are necessary to predict SOC density (g cm−3) from soil %OC by weight, a fundamental limitation of this approach at national scales is the underrepresentation of field-relevant wetland (or hydric) soil measurements, leading to an apparent overestimation in bulk density measurements e.g. (24), often due to spatial extrapolations across discontinuous soil types, especially at depth due to difficulty of bulk density sampling at depth in wetlands (25). In this analysis, the EPA NWCA data set was used exclusively because (1) the sampling design was statistically representative of wetland spatial variability and (2) core collections across all CONUS wetlands optimized accuracy of measurements (26). We compared this wetland-specific database to the more spatially extensive measurements of %OC in the USDA SSURGO field survey data base to optimize data harmonization across the entire CONUS. Other databases were not included in model development due to biased dataset structure, lack of spatial and depth representativeness, and concerns of method variability and accuracy.
Harmonizing multiple datasets to combine strengths and identify biases improves our understanding of SOC stocks in CONUS wetlands. A spatially explicit landscape survey, such as the USDA NCSS database (27), improves accurate upscaling and assessment of spatial patterns to identify constraints on soil properties. A national scale, spatially representative, point-based dataset targeted on wetland soils, such as the EPA National Wetland Condition Assessment (28) pays unique attention to wetland sampling needs and allows verification of spatial and downcore patterns across representative conditions. Used together, with wetlands identified by the USGS National Land Cover Database Homer et al. (29), they allow generation of a three-dimensional representation of modeled SOC density at 10 cm depth increments to 1 m for inland wetlands, creating a more accurate and spatially representative product.
Our approach leverages the commonality of organic carbon content (%OC) measurements in wetland soils and the strong predictive relationship of %OC on SOC density (16). In particular, we used NWCA's regionally stratified %OC dataset in two ways: (1) to validate its representativeness of %OC data in SSURGO and (2) to develop a predictive SOC density model for mean and standard deviations of soil carbon stocks using %OC alone. As the NWCA data were found representative at regional scales (14), this empirical model was applied to SSURGO %OC data at 10 cm increments to predict SOC density in a layered, spatially explicit map. We describe below the final model approach, which found two model domains (“soil classes”): one where SOC density increases with %OC and one where SOC is constant while %OC increases. We refer to these classes as “mineral” and “organic” soil types, respectively. The only parsimonious disaggregation were geographic (inland vs. coastal) and regional (14). We then use this approach to generate layered mapped products with quantified precision, limited bias, and improved spatial representativeness in distributions of SOC stocks to 1 m depth for inland and tidal wetlands of the CONUS. As a result, these map products, at the scale of 30 m pixels and 10 cm depth increments, illustrate spatial and downcore patterns in wetland soil carbon stocks that (1) improve regional assessments and (2) illuminate needs in future assessments of wetland carbon vulnerability.
Methods
There are three main components of the methodology used for this approach to map generation (Figure 1). The first component is toward representativeness, validating the spatial, and statistical distribution of SSURGO wetland %OC data through comparison with the NWCA %OC data at by region, depth, and landcover. The second component reduces bias by developing an accurate model at appropriate levels of disaggregation to predict SOC density from gSSURGO data on %OC for wetland landcovers at regional scales. The third component is an assessment, performed by analyzing harmonized maps in comparison with single sourced map products, such as EPA NWCA (14), NCSS gSSURGO (13) and Soilgrids 250 m (21). Figure 1 contains a flowchart with an overview of the methodology in this assessment. Detailed discussions of statistical decisions [e.g. R Core Team, (30)] are described in Supplemental Text 1.1.
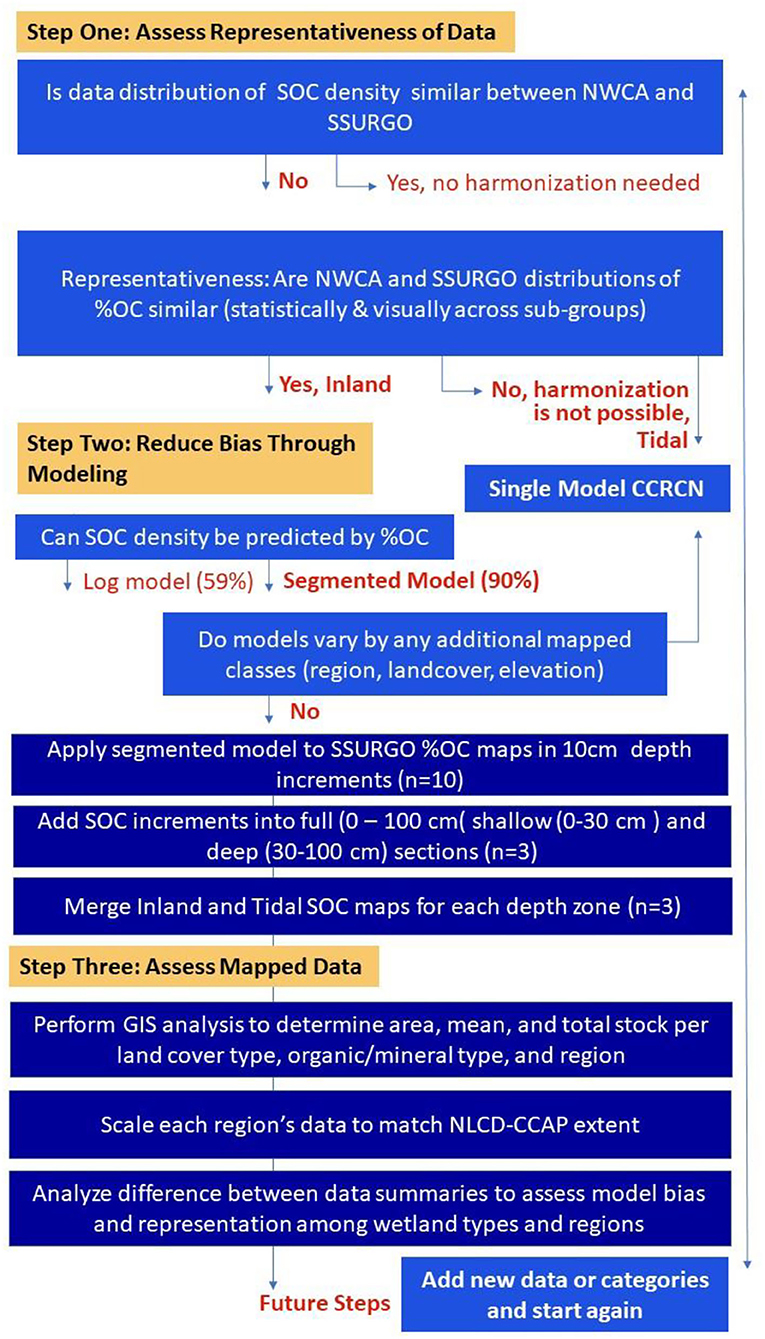
Figure 1. A flowchart visualizing the three-step approach for data harmonization between survey (I.E. SSURGO) and point-based soil datasets (i.e., NWCA) for assessment of (1) representativeness, (2) bias, and (3) resulting data.
Methods, Step One: Representativeness Of Wetland Data
Inland Wetland Data Sets
The EPA National Wetland Condition Assessment (NWCA) is a recurring wetland-specific and spatially-representative assessment of soil, plant and water characteristics, to support wetland resource trends (26). In 2011, field crews visited 967 wetland sites, probabilistically selected using USFWS NWI classes, across the CONUS, in partnership with states and tribes (Figure 2). Soil pits up to 120 cm deep were excavated at each wetland site to obtain soil samples across a soil profile which were later analyzed for physical and chemical attributes, such as total and inorganic carbon as well as bulk density samples (14, 28, 31). We examined the data for errors and duplication, omitting data-points not in the original probabilistic sampling design (e.g., revisitation) as well as a small number of sites recommended for removal by the database creator due to quality control. All bulk density values (ranging from 0.02 to 1.99 g cm−3) were retained, but any %OC values above 58% were removed (26 samples), to avoid errors associated with calculations >100% organic matter. The remaining 794 total sites, with 529 of those being inland sites, were divided into ecologically-based regions that represented four collapsed EPA Level 3 Ecoregions: Coastal Plains (CPL), Eastern Mountains and Upper Midwest (EMU), Interior Plains (IPL), West (W) regions, as well as into woody and emergent herbaceous wetland types (NLCD classes 90 and 95). Data from the 529 inland NWCA sites were extracted and subsampled with R into equal depth increments (10 cm) in order to statistically and spatially compare distributions with non-imputed data of SSURGO.
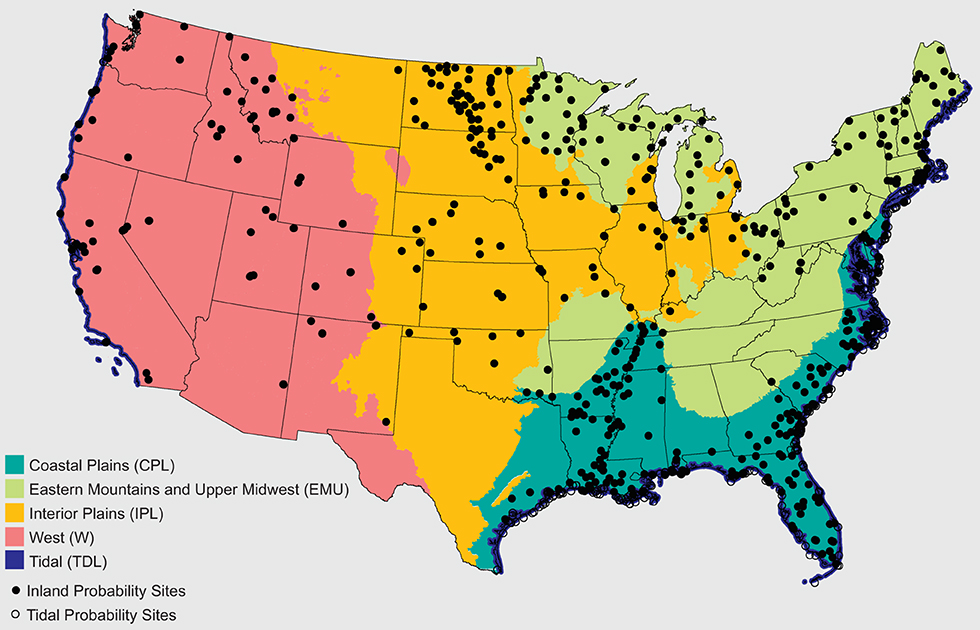
Figure 2. Wetland soil regions (as collapsed by data similarity from EPA Level 3 ecoregions) and distribution of NWCA soil core samples (14).
The United States Department of Agriculture Natural Resources Conservation Service (USDA-NRCS) conducts the National Cooperative Soil Survey (NCSS) and compiles this soil information in the Soil Survey Geographic Database (SSURGO), a comprehensive database that is also available in a gridded format (gSSURGO) as a raster with related attribute tables. To facilitate comparison of the SSURGO data with the NWCA data, data were extracted from hydric soils in SSURGO in 10 depth layers, each of which used the top 1 cm to represent the 10 cm in the depth layer. The data, as 30 m × 30 m rasters, were overlaid with the Nahlik and Fennessy (14) regional boundaries and the NLCD 2011 30 × 30 m pixel landcover map (29) to create landcover and regional classes. Rasters were summarized in frequency tables with 464 bins in 0.125%OC increments. Because NLCD spatial data are informed by the US FWS National Wetland Inventory (NWI) landcover maps, wetland area was similar to NWI-distributions of CONUS wetland area (Table 1). Only true samples (non-imputed) representing site-specific soil measurements in SSURGO's database that landed within an NLCD wetland area were analyzed.
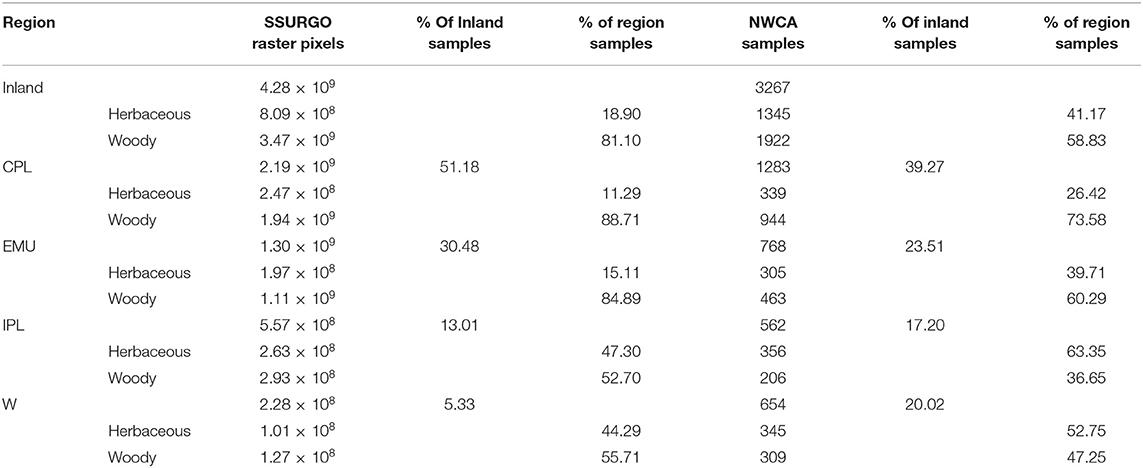
Table 1. Area and count distributions for assessing representation of data in NLCD-based extraction of SSURGO and NWCA data sets for all Inland values, for the Coastal Plains Region (CPL), for the Eastern Mountains and Upper Midwest Region (EMU), for the Interior Plains Region (IPL), and for The West Region (W).
Within coastal lands under tidal influence, the National Science Foundation (NSF)-funded Coastal Carbon Research Coordination Network (https://serc.si.edu/coastalCarbon) provides a community contributed, open-access, global repository with depth-specific coastal wetland soil carbon data from all tidal settings, ranging from freshwater tidal forests to intertidal herbaceous wetlands to subtidal seagrass beds. Raw soil data for CONUS tidal wetlands were downloaded and cleaned to represent only “emergent” vegetation classes (removal of submerged aquatic vegetation and un-vegetated wetland settings, such as mudflats and unconsolidated shore, which did not meet our wetland definition). These emergent intertidal elevation soil cores (n = 1,359), were then characterized by relative elevation classes [e.g., high intertidal marsh vs. low intertidal marsh (32)] and across 13 Level III EPA ecoregions. A recent publication by Holmquist et al. (24) indicated a mean CONUS SOC density value of 0.027 g C cm−3 among tidal wetland sites and downcore to 1 m, and thus our analysis tested additional disaggregation options, by relative elevation and ecoregion.
Demarcating and Merging Inland and Tidal Wetland Datasets
Inland and tidal wetlands were demarcated using their landscape position and location above or below a physically-derived probabilistic boundary of tidal hydrology (>1% probability of being below the Mean High High Water Spring Tide, MHHWS (33), available for download from the NASA Carbon Monitoring System at: https://daac.ornl.gov/CMS/guides/Uncertainty_US_Coastal_GHG.html.
Wetland landscape classifications were taken from the USGS National Landcover Change Database (available at https://www.mrlc.gov/data/nlcd-2011-land-cover-conus) and the NOAA Coastal Change Analysis Program (34) products for inland and tidal wetlands, respectively. Rather than use the USFWS National Wetland Inventory, we chose the LANDSAT-derived USGS and NOAA products due to their consistent timeframe, their ability to be used with repeated measures (~every 5 years), and their binary wetland landcover classification (woody v. herbaceous vegetation). CCAP provides salinity classes for estuarine (>5 ‰) and palustrine [<5 ‰; (34); (29)] tidal wetlands. CONUS wetland extent between 5 year iterations of NLCD and CCAP were cross-checked with NWI wetland extent. There were no significant deviations beyond small, expected (~2%) increases in CONUS wetland extent classified as “tidal” when using a physical boundary rather than the NWI tidal hydrology classes (35). These wetland locations, from NLCD 2011 (inland) and CCAP 2010/2011 (tidal), provided the spatial 30 m resolution mapped extents upon which 10 cm soil layers were projected and analyzed spatially and statistically.
Validating Inland Data Through Representativeness Across SSURGO and NWCA Data
Percent OC distributions from SSURGO and NWCA were compared in each depth increment (n = 10), vegetation category (n = 2), and region (n = 4) to determine similarity and gaps in data distributions at the CONUS scale. Samples were not assessed based on soil texture due to variable classifications (dry vs. wet-sieved, grainsize, etc), and our goal to model SOC density with a single confident and widely measured parameter, to avoid risks of overfitting or bias e.g. (36). As an initial assessment, the mean %OC values for each combined region and vegetation type were plotted against one another (Figure 3) and found to have similar means and standard deviations within regions. The %OC values for each 10 cm increment found in SSURGO were correlated with %OC in NWCA with no significant bias, and nearly a 1:1 relationship between mean values (slope = 0.96, Pearson R = 0.94).
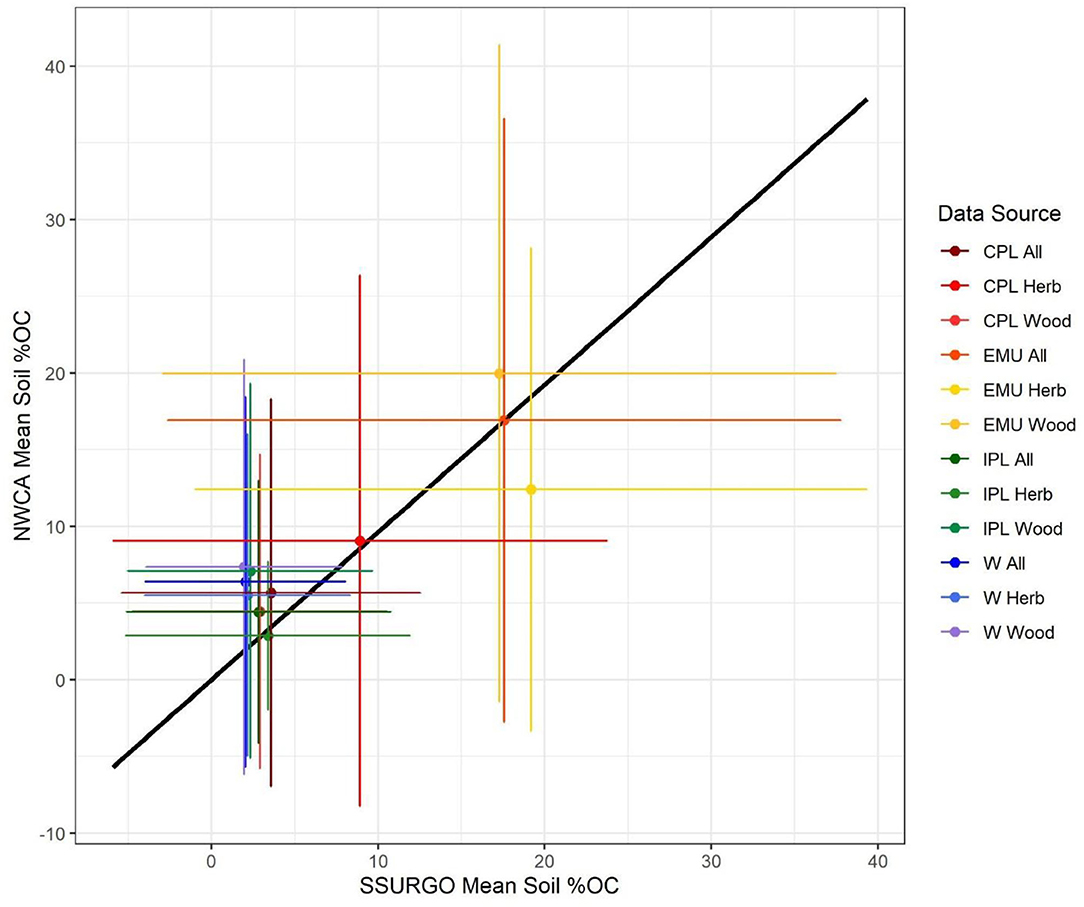
Figure 3. Correlation of means of wetland soil %OC values in USDA's SSURGO2016 and EPA's NWCA 2011 datasets. Error bars represent 2 standard deviations. Regions (n = 4) were assessed for 3 categories (all wetlands, only herbaceous wetlands, or only woody wetlands), and 4 inland regions: Coastal Plains (CPL), Eastern Mountains and Upper Midwest (EMU), Interior Plains (IPL), and West (W).
Artifacts of field assessments used in SSURGO, such as a large spike in data density at 37.625% OC (corresponding to roughly 65% organic matter) in the EMU region data, were smoothed by averaging adjacent bins. Distributions were also compared for select quantiles (5, 25, 50, 75, 95%). When assessed by depth, the downcore decrease in data density was apparent but remained an insignificant term for disaggregation. Distributions %OC in both SSURGO and NWCA data were found to be lognormal, with a mode of 2% OC across the full range of values (0–58% OC).
The equivalency of %OC data distributions between SSURGO and NWCA was consistent at the regional scale, and was less powerful for vegetation classes, implying a limited ability to harmonize datasets at the scale of vegetation types (woody vs. herbaceous). Notable diversions from the confidence in this correlation are in the vegetation classes in EMU (Figure 3, shown in yellow and gold), whereby SSURGO and NWCA %OCs were similar for EMU overall (means of 17 and 17.5% OC) but diverged in their representation of herbaceous and woody wetlands (NLCD landcover classes 90 and 95). Further, herbaceous wetlands in EMU represented 40% of NWCA samples but only 15% of SSURGO samples (Table 1), further suggesting difficulty in reliably characterizing vegetation classes in NLCD-delineated SSURGO data. We therefore suggest that extrapolating NLCD relationships to SSURGO spatially explicit distributions was appropriate for regions, but not defensible for NLCD landcover (vegetation type) subclasses.
Step Two: Model Fitting
Inland Data
We suggest three reasons to model SOC density from %OC alone. One, %OC, a weight for weight measurement, is a common and relatively confident soil metric that is either directly measured or calculated as fraction of the organic matter (28). Two, multiple pedotransfer functions e.g. (16, 23) indicate %OC as the dominant driver of bulk density. Three, both the NWCA distribution of %OC and SOC density followed a lognormal distribution (Supplemental Figures 3.1A,B). A logarithmic regression (Equation 1) supported a predictive relationship such that %OC in a soil sample could provide a relatively confident (R2 = 0.59) prediction of SOC density for the NWCA dataset (Equation 1):
The heteroskedastic distribution shown in Supplemental Figures 3.2C–E was also supported by Levene's tests, which indicate that the mathematical assumptions used by a least squares regression were not met by these data sets (Supplemental Text 1.1). Statistical relationships in the data distribution were assessed to determine the optimal breakpoint for a linear increase section (hereafter “mineral” section) and the constant section (hereafter “organic” section). Several statistical methods (Table 2) were compared to assess sensitivity to model assumptions. First, a quantile regression was established by using a quantile segmented regression (using quantreg, segmented, and multikink R packages). A least squares regression (stats, segmented) was performed for the data below the break point with no significant change in mineral slope or the organic value. Finally, these regressions were compared against a least- squares segmented regression on the log transformed data, with similar results. A least squared linear approach across the entire dataset led to poor model performance (Supplemental Figure 3.2B), leading to a consensus for breakpoints ~6% OC as a predictive metric of soil C stock. Breakpoints were also assessed for disaggregated classes but were not shown to differ significantly in model performance for individual regions or landcover types (Supplemental Figures 3.3A–F and Supplemental Table 2.1).
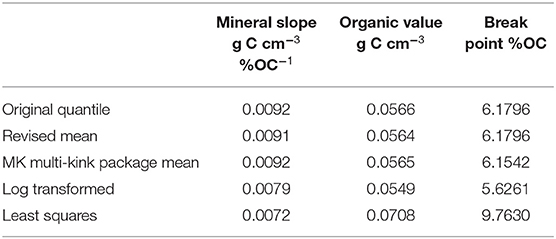
Table 2. Model coefficients for each segmented model technique.
The inland data were divided into depths for the purposes of determining the effect of sample depth on the relationship between %OC and SOC density. Small sample sizes at depth (<50% of soil cores had data available below 50 cm depth; Supplemental Table 2.2) negatively affected the reliability of the regression. No trend was found for changes for break point location, mineral section slope, or organic steady state value when each depth was used individually.
Because disaggregation did not alter or improve any further model performance, a single break point was used to produce a final set of models that constrained two different portions of the distribution (Figure 4). Segmented modeling of SOC density (g C cm−3) generated RMSEs of 0.0059 for mineral soils and 0.0348 for organic soils, nominally 4 and 56% of predicted values. For the range of NWCA values available for SOC density, ~77% of organic-soil values and 79% of mineral-soil values were described using this methodology. While the range of residuals around the mineral distribution was somewhat evenly distributed, for the organic soils there were approximately twice as many samples above as below the modeled mean (15 vs. 8%). The mineral and organic section residuals from the broken stick model show an approximately normal distribution for mineral section and a curve similar to a normal distribution for the majority of organic soil residuals with a right tail where the few unusually high positive values lie (Supplemental Figures 3.1C,D).
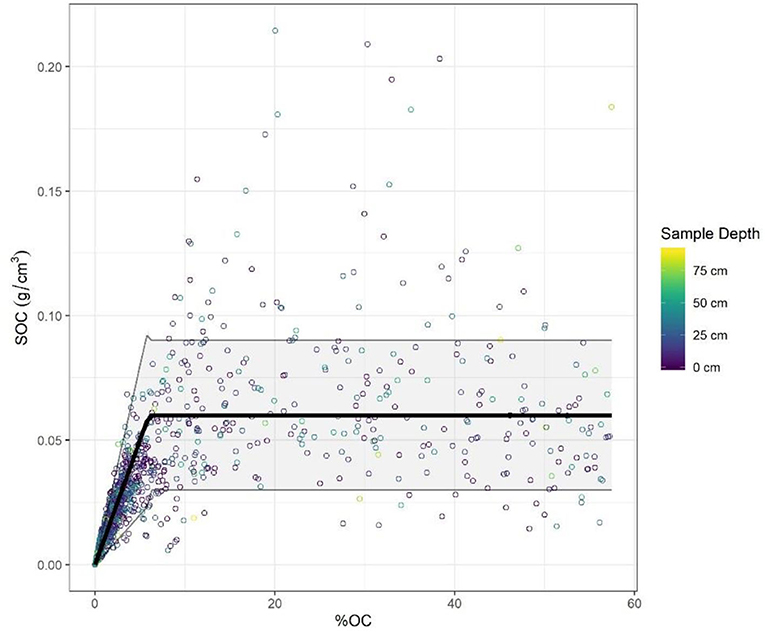
Figure 4. SOC density v % OC for Inland Wetlands from NWCA 2011. Broken stick model and uncertainty shown as in Equations 2, 3. Color is used to indicate the sample depth. Modeled SOC grows linearly with %OC until 6%OC then is constant. Seventy six percent of the data points correspond to Equation 2 (Mineral) and 24% of the data points correspond to Equation 3 (Organic).
In the final model, the mineral section SOC density increased linearly with increasing %OC and was modeled as follows in Equation 2. The equation is written such that the slope is in units consistent with bulk density measurements and is shown to be multiplied by the %OC times 0.01 (fraction of OC).
In the final model, the organic section SOC density did not increase with increasing %OC and was modeled as follows, obtained from the SOC at the break point
A break point of 6% OC was thus used to determine statistical distributions within each soil grouping (mineral and organic) for both the SSURGO and NWCA data. The decision to use a single significant figure affected <1% of data in this distribution. Further, this decision simplified a bulk density estimate of 0.9 g cm−3 within the mineral section, which is similar to the mean of bulk densities reported as mineral soils in Nahlik and Fennessy (14) (0.98 g cm−3). We feel this is appropriate given the precision of the bulk density and %OC measurements provided. Given the similar spatial and statistical representation of SSURGO and NWCA's %OC data, we applied the spatially representative NWCA-derived model (Equations 2, 3) to the spatially extensive gSSURGO map of %OC to create a map of SOC density distributions at 30 m spatial resolution and in 10 cm depth intervals. This break point establishes that 76% of NWCA samples can be categorized as “mineral soils” and are well-characterized by this model.
Tidal Data
After testing multiple breakpoints for tidal wetland %OC and SOC density data from the NSF-CCRCN dataset, our results ultimately supported the conclusions of Holmquist et al. (24), which includes the highest confidence estimate currently available for tidal wetland soils: a mean SOC density of 27 ± 13 kg C m−3. Despite the normal distribution of the CCRCN tidal wetland data (Supplemental Figure 3.1E), tidal wetland data showed a similar breakpoint to inland data for %OC; Holmquist et al. (24) least squares breakpoint of 13.4%OM (organic matter) to predict SOC density was similar to the 6%OC breakpoint identified in our analysis of inland wetlands when %OM is converted to %OC (~45% of OM estimated to be OC, by weight). The potential for tidal wetland disaggregation by organic and mineral soil types thus exists; however the gSSURGO product does not currently provide a confident base map of %OC for the tidal wetland soils (24), and thus cannot support the harmonization approach used for inland soils.
Similar to Holmquist et al. (24), tests of disaggregation by vegetation type, by climate zone, by depth, and by salinity class, showed no statistical differences among variables that might result in improved accuracy or reduced bias in our estimates of tidal wetland SOC density across CONUS (Supplemental Figure 3.4B). In addition, the spatial disaggregation of relevant cores was tested by two new spatial categorizations, specifically (a) relative elevation within a tidal framework [Z*, (32); n = 4 elevation classes] and (b) EPA Level 3 Ecoregion (n = 13 with data). Relative elevation class (based on Z*) had no effect on the mean SOC density, nor on the profile of SOC density to 1 m depth. The only Ecoregion that emerged as slightly different than the CONUS mean was Ecoregion 34 (Galveston Bay, Texas), where SOC densities were slightly but not significantly lower than the CONUS mean [(37) 22.2 ± 10.3 kg C m−3]. Our CONUS mean SOC density value was slightly but not significantly lower than the Holmquist et al. (24) data (26.4 ± 13 kg C m−3), likely because our 2019-extracted data set included additional data points (including Ecoregion 34; Supplemental Table 2.3).
Further supporting a lack of benefit in disaggregating tidal wetland soil data, a downcore regression (Supplemental Figure 3.4A) indicated a nearly 1:1 relationship (slope = 0.94, R2 = 0.92 for emergent cores) between the SOC density in the top 20 cm of a core (0–20 cm) and the lower 80 cm (20–100 cm) deeper section of the core. This relationship was consistent across ecoregion and relative elevation classes with all regressions approaching 1:1 and R2 values > 0.9. While tidal wetland SOC density variability was high among the CCRCN dataset (Supplemental Figure 3.4B, it had low variability within cores, such that neither depth, nor Ecoregion (n=15) nor relative elevation was a significant predictor of SOC stocks for any depth increment.
Merging Datasets
Data compilation was specific to inland and tidal wetlands, as demarcated by the probabilistic tidal boundary (35). Data for all NLCD (2011)-classified inland wetlands were extracted from each of 10 gSSURGO raster maps that represented soil cores in 10 cm increments (30 m resolution, n = 10 maps comprising 0–100 cm depth). Each pixel was assigned a range of minimum likely, mean, and maximum likely SOC density values using the model (mean ± 1 SD). Rasters for all CCAP (2011)—classified tidal wetlands were assigned values for the minimum likely, mean, and maximum likely SOC density values from Holmquist et al. [(24), mean ± 1 SD]. Tidal and inland wetland maps were merged for the mapped assessment. The full CONUS rasters (inland and tidal wetlands) for each 10cm depth zone were merged to create three depth-specific maps: (a) shallow SOC stock map for the top 30 cm, (b) a deep SOC stock map for 30–100 cm, (c) a full first 100 cm SOC stock map to create rasters. For each of these raster maps, we created a map for (a) mean values, (b) likely minimal values (mean −1 SD) and (c) likely maximal values (mean + 1 SD) for CONUS SOC density. These nine maps (three representative depths and three statistics) were analyzed on the basis of landcover (n = 2, woody vs. herbaceous), soil type (n = 2, “organic” vs. “mineral”), and regional position (n = 5, CPL, EMU, IPL, W, and Tidal).
Step Three: Assessment of Merged Map
Results of the raster analyses were assessed using R based on either landcover and soil class (n = 4: herbaceous mineral, herbaceous organic, woody mineral, woody organic) and region (n = 5: CPL, EMU, IPL, W, Tidal). This allowed for comparison between the modeled SOC stock values and mass SOC values determined by SSURGO alone to 1 m depth (13). To further support comparison with landscape-specific stock estimates (12, 14), areas were scaled arithmetically for each region to account for the small percent of wetland area not covered in the gSSURGO data set (Table 3), thus slightly revising upward the acreages reported in Table 1 to account for areas with NLCD-described wetlands that do not contain data in the SSURGO data set. Overall, a 6% difference in total CONUS wetland area was observed, although a 26% difference in the West region suggests significant underrepresentation of wetland extent within gSSURGO.
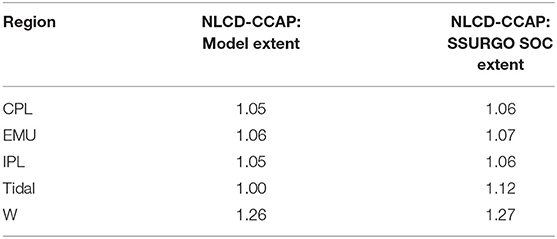
Table 3. Ratio of areas between the SSURGO %OC or SOC wetland data and NLCD/CCAP wetland extent for different regions: Coastal Plains (CPL), Eastern Mountains Upper Midwest (EMU), Interior Plains (IPL), Tidal, and West (W).
Figure 4 illustrates the relative distribution of inland and tidal wetlands for the U.S. with four classes by landcover and soil type within the four inland regions of the U.S. Independent assessments are described further below in regard to carbon accounting and vulnerability. The harmonized final products illustrated the relative importance of wetland soil carbon stocks at regional scales, with implications for overall carbon accounting and vulnerability in inland wetlands.
Results
We estimate a CONUS stock across all inland and tidal wetlands of 9,468 Tg C. This estimate combines a tidal wetland estimate of 1,081 Tg with the inland estimate of 8,387 Tg of soil organic carbon (SOC) in the first meter of inland wetland soils. A wide range of estimates constrain 68% of the data (4,457–14,586 Tg), and the majority of variability is apparent for organic wetland soils (mean = 60 ± 30 kg m−3, Table 4). Regionally, the EMU represents the largest stocks, at 49% of the entire CONUS SOC stock, largely due to its dominance of organic soil wetlands. Whereas, 43% of all CONUS wetlands are in the CPL region, these wetlands are dominantly “mineral” wetlands, and thus the mean SOC stock in CPL is roughly 39% the mean SOC stock in EMU (12.9 vs. 33.0 kg C m−3). The IPL regional average also tends toward mineral soil types (14.8 kg C m−3), as does the West (12.0 kg C m−3). Tidal wetlands tend toward an organic soil type (27.0 kg C m−3), although technically averaging below the minimal organic soil distribution (30.0 kg C m−3).
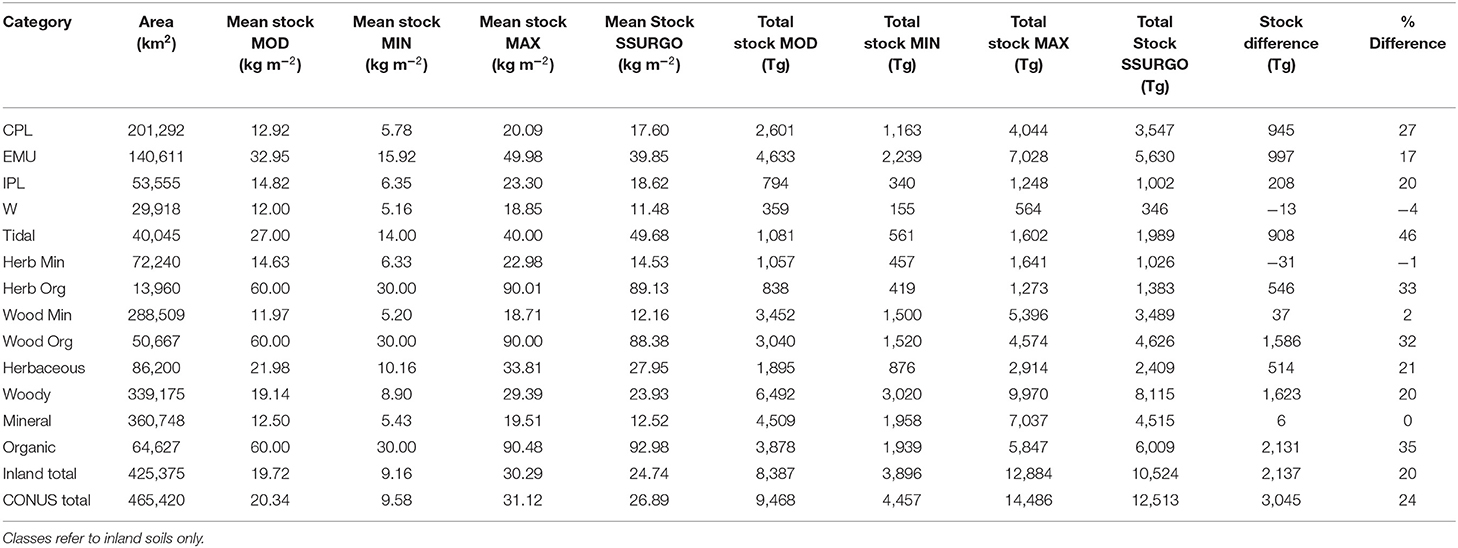
Table 4. Soil organic carbon (SOC) stock by region Coastal Plains (CPL), Eastern Mountains and Upper Midwest (EMU), Interior Plains (IPL), and West (W), and by class (herbaceous, woody, organic, and mineral) for the first meter of soils.
This harmonized spatial dataset revises published estimates of CONUS wetland soil C stocks downwards. For inland soils to 1 m depth specifically, SSURGO mass-based estimates of 10,524 Tg SOC are 20% higher than our estimate of 8,387 Tg SOC, although still below our modeled maximum likely value (12,884 Tg SOC). Detailed regional analysis of SSURGO-estimates indicates ~25–26% higher mean stocks in at least 2 regions, CPL (17.6 kg Cm−3) and EMU (39.9 kg C m−3), which together represent 73% of all CONUS wetland acreage. These regional overestimates appear to be influenced by a bulk density bias that is specific to organic soils. When stocks were analyzed for mineral soils alone, our modeled data matched SSURGO mean estimates exactly (12.5 vs. 12.5 kg C m−3). The SSURGO estimates, however, showed 32–33% higher stock values for organic soils than our harmonized data (93.0 vs. 60.0 kg C m−3), and were larger than our maximal projection of 90 kg C m−3. Because most differences were seen in organic soils, which accounted for 15% of all wetland area and 46% of all SOC by mass, the spatial distribution of bias is specific to the relative abundance of organic soils within a region.
The most significant deviation of our product vs. SSURGO-based estimates e.g. (12, 13) was the revision of the inland CONUS wetland soil carbon stock downward by ~24% (8,387 vs. 10,524), primarily due to bias-corrections in the organic soil horizons. Figure 6 illustrates the distribution of variability among regions and among wetland soil types, with SSURGO (in red) over-predicting total and mean soil stocks in organic wetland soils, regardless of landcover class. Mineral soils were relatively well-constrained, with our average mineral soil carbon stock of 12.50 kg m−3 being similar to SSURGO's value of 12.48 kg m−3. To test another SSURGO-informed product provided by the World Soil Information Service1 WoSIS (19), independent comparison with WoSIS means were performed for a single SoilGrid250 tile in Wisconsin, USA (−99.745 to −86.745 longitude, 40.120–42.120 latitude). Due to its strong mineral soil signature compared to more organic regions (38), and due to modulation of WoSIS data by incorporation of International and Soil Reference and Information Center (ISRIC) point-based soil samples as well, the SoilGrid250 mean of 0.013 g C cm−3 was very similar to our harmonized model mean estimate of 0.01 g cm−3 (Supplemental Table 2.5). For another CONUS scale comparison, our harmonized model CONUS stock of 9.5 Pg generated was lower than a CONUS assessment by Nahlik and Fennessy [(14), 11.52 Pg]. Because we relied on the same NWCA soil core data, the primary difference in accounting was in spatial upscaling, whereby Nahlik and Fennessy (14) uses a ratio of NWI classes for their upscaling rather than a spatially-explicit manner as enabled by gSSURGO. Given the regional variation in datasets downcore data representativeness, especially in the Western region (Supplemental Table 2.5), improved representation of more mineral-rich wetlands in the SSURGO-survey may have driven our lower CONUS scale estimate. Regional variation in SOC stocks was significant and may be why the upscaling variability illustrated the importance of Eastern Mountains and Upper Midwest region (EMU) with the greatest total SOC stock and the greatest mean wetland SOC stock values by region, due to a higher percentage of organic soils. West and Interior Plains (e.g., prairie pothole) wetlands have a similar mean SOC stock as Coastal Plains wetlands, but a much lower regional stock due to a smaller wetland area in those regions.
NWCA and SSURGO data were assessed for patterns in sample representation to further determine if there are issues with representativeness downcore on a regional basis. Not only are there very few deep samples in western regions, SSURGO bias may also underestimate soil core data at depth due to imputation across soil pedons (mineral layers extrapolated spatially at depth due to limited sampling; Supplementary Table 2.5).
Figure 7 illustrates the relative distribution of soil stocks by depth and by region. Stock assessments at 0–100 cm were compared with 0–30 cm (shallow) and 30–100 cm (deep) segments to aid in comparison with other studies of soil profiles (Supplemental Table 2.6). Shallow stocks had different predictability of deep stocks depending on their soil class, organic vs. mineral. Figures 5A–C illustrate whole core SOC stocks (mean and total) as a compilation of shallow (0–30 cm) and deep (30–100 cm) core increments, by region and in comparison, they illustrate different downcore patterns were observed by soil class. Whereas shallow soils classified as mineral (<6% OC) showed evidence of declining stocks with depth (mean of shallow soils 3.23% OC, mean of deep soils 1.99% OC), shallow organic soils (>6% OC) largely maintained their stock value downcore. More than 2/3 (n = 81) of the 120 NWCA cores classified as organic in the shallow section remained at >6% OC through all depths downcore; the remaining 39 cores varied but had an average of 5.26% OC. Thus, soils with modeled organic SOC densities of 0.060 g C cm−3 in the surface (0–30 cm) have a mean modeled organic SOC density of 0.055 g C cm−3 in the deep soils (30–100 cm), a decrease of <10% and well within the SOC density model error (0.030 g C cm−3). In contrast, soils not classified as consistently organic in the top 30 cm had a significant stock loss downcore, from a mean of 0.029–0.018 g C cm−3 from shallow (0–30 cm) to deep (30–100 cm) soil stocks, a decrease of 37%, and well outside the SOC density model error of ~10%. We note that variability also increased downcore due to lower sample counts (Supplemental Table 2.6), but the differences in profiles were persistent by soil class in the NWCA data. This difference in consistency of stock downcore was not evident in the SSURGO-derived dataset, which implied a 33% loss of stock across all cores, regardless of classification. This perceived downcore loss in the SSURGO-%OC data may be an artifact of the way data are interpolated at depth in the gSSURGO system. This is not the case for the data analyzed to validate the %OC in SSURGO which only included hydric soils and not interpolated data.
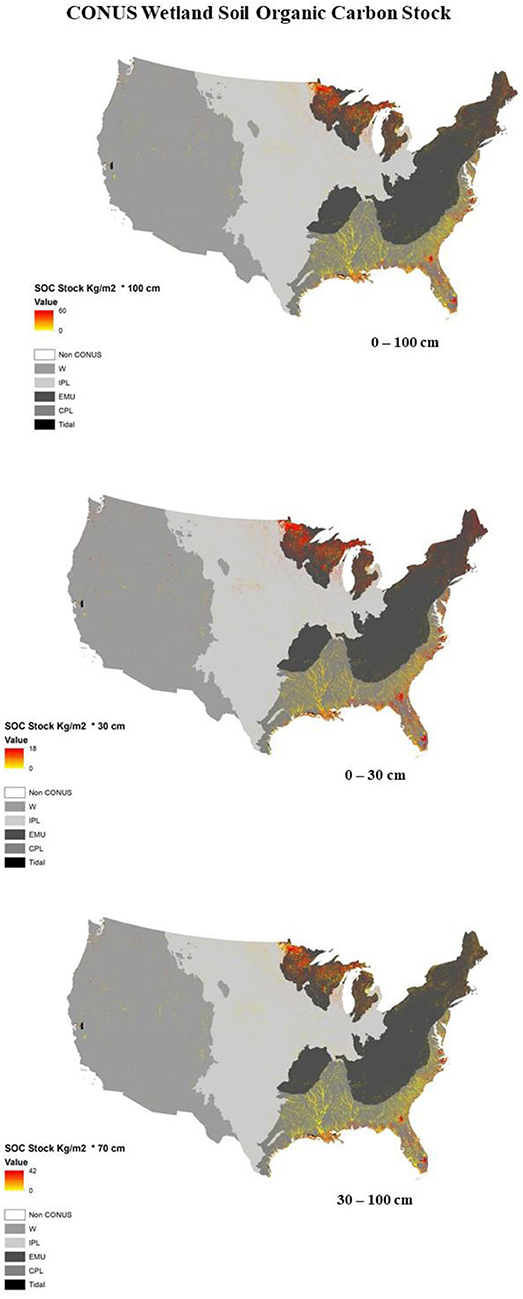
Figure 5. Map of CONUS Inland and Tidal wetland locations and types with regions shown in greyscale: West (W), Interior Plains (IPL), Eastern Mountains and Upper Midwest (EMU), Coastal Plains (CPL), Tidal. Modeled soil organic carbon stocks for the first meter, 0–30 and 30–100 cm heat map for wetland soils shown in yellow to red.
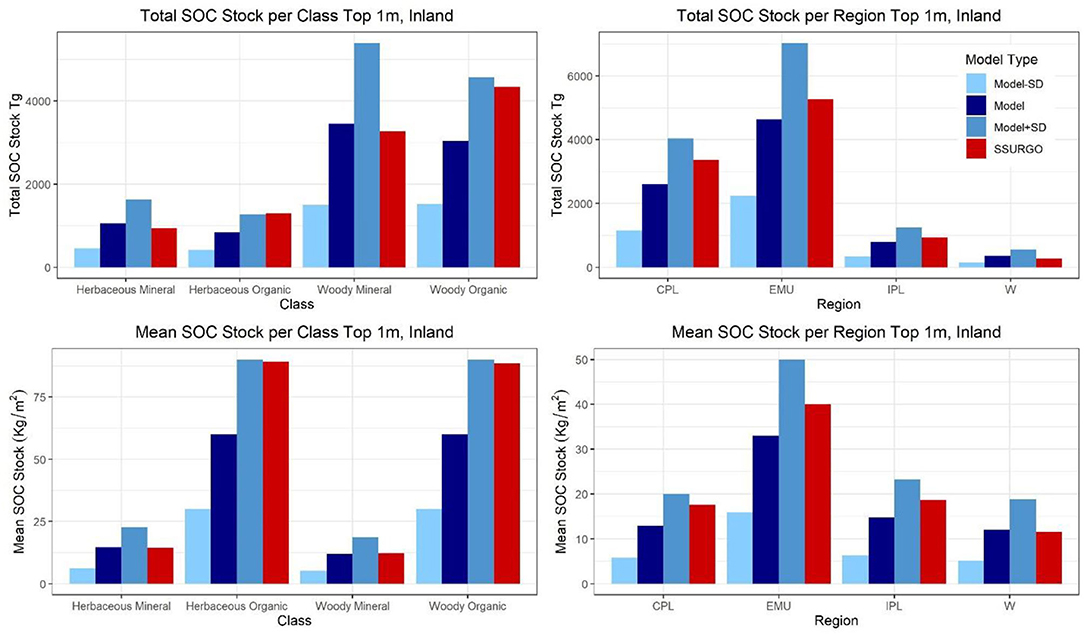
Figure 6. A Comparison of Modeled Values and SSURGO Values across the regions (Coastal Plains, Eastern Mountains and Upper Midwest, Interior Plains, and West) and classes (Herbaceous or Woody and Mineral or Organic) for total or mean soil organic carbon stock.
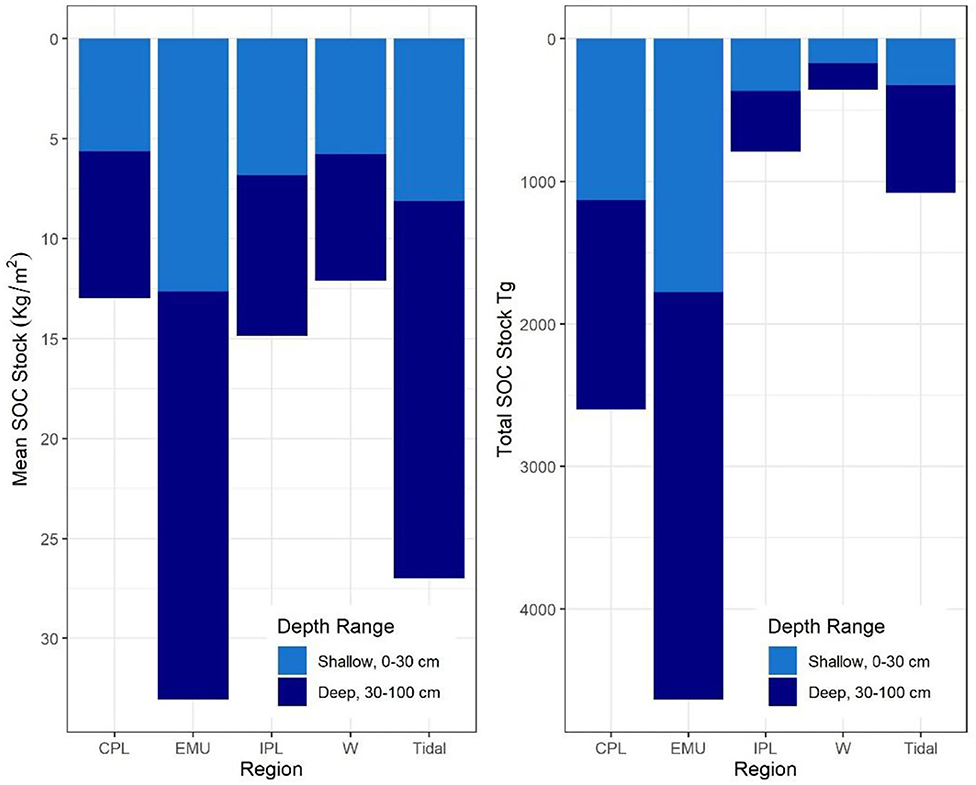
Figure 7. Mean and total stock in CONUS wetlands by depth zone (0–30 vs. 30–100 cm) and by region: Coastal Plains (CPL), Eastern Mountains and Upper Midwest (EMU), Interior Plains (IPL), West (W), and Tidal.
Discussion
Disaggregating wetland soil classes as either “mineral” or “organic” improves accounting approaches that harmonize across survey and point data. We found that SSURGO mineral soil types dominated CONUS wetland C stocks, but that SSURGO calculations were likely overestimating organic soil densities (mean 93.0 kg C). We found that SSURGO also potentially underestimated organic soil presence at depth, due to projected stock losses at percentages more commonly seen in mineral soil cores. Given the unique sampling needs for accuracy, precision and representativeness in discontinuous wetlands, wetland-specific datasets (EPA's NWCA, NSF's CCRCN, etc) are necessary constraints on upscaled soil stock assessments. We suggest that improved mapping and sample collection from poorly represented wetland types and conditions (e.g., disturbed or compacted wetlands) will improve confidence in future soil C stock estimates and help quantify wetland soil management opportunities e.g. (39). We discuss here three significant observations from this harmonized assessment on (1) wetland soil carbon stocks, (2) soil carbon profiles, and (3) simplified C stock modeling based on %OC alone.
Soil Organic Carbon Stock Mean Values by Mineral and Organic Class
Our empirically-derived breakpoint for classification of wetland organic soil stocks (6%) is lower than standard characterization of organic soil properties [~10%, e.g. (4, 40)] due to the initial regression around the median rather than the mean. Our proposed empirical disaggregation is derived to optimize precision in the accounting by reducing RMSE about all wetland soil types, not to re-characterize organic soil classes in general. Despite their low relative area at the CONUS scale, these organic-soils have a high impact on overall wetland carbon-stock assessments. The single most effective way to improve confidence in the wetland carbon stock values is in improving soil sample representativeness and identifying disaggregation opportunities that are mappable (e.g., hydrogeomorphic setting, past disturbance, etc). Further, this new distribution more adequately addresses the empirical representation observed in the NWCA dataset, and due to the quantile regression, extreme values do not play an outsized role in determining the mapped mean value.
Soil Organic Carbon Distributions as a Framework to Assess Carbon Stock Vulnerability
These harmonized data provide a new view of CONUS wetland soil carbon resources, including three significant findings for wetland carbon vulnerability analysis in organic soils. First, organic wetland soil stocks were similar across 10 cm layers of the 0–1 m profile (Figure 5) illustrating significant soil carbon preservation mechanisms with depth below the soil surface, and consistency with the observed pattern in tidal wetlands (24). The only soil profiles with observed decreases in soil C density were within the mineral soil category (<6% OC), as sites with surface organic soil layers showed no significant down-core patterns of decreasing SOC density. This suggests that any downcore patterns of SOC density observed in gSSURGO's mapped organic soils are potentially biased by imputed upland influences at the pedon level e.g. (24). This relatively consistent downcore SOC density pattern in wetlands with organic soils suggests that their SOC stocks at depth are highly vulnerable to increases in microbial activity due to temperature, priming or hydrologic alteration.
Second, these organic soil stocks show a wide range of SOC densities which were not predictable from mappable wetland classes tested. Despite all tested sources of disaggregation (region, vegetation, depth) OC densities were similar in their median asymptote at 0.0566 gC cm−3, although the range about this asymptote was large (min 0.01 to max of 0.21, Figure 4). The large range of density variability is likely due to landscape influence, such as historical drainage or groundwater-to-surface water connectivity, two currently unmapped characteristics. Whereas, mineral soil C densities were relatively well-predicted by the %OC reported, organic soil estimates for CONUS may be improved by informed maps of land use history and changes in hydrologic setting, as well as more sensitive sampling approaches to improve their model representation.
Third, median and mean values for C density in organic wetland soils were lower in our analysis than reported with gSSURGO data, and some of the products to which SSURGO has contributed (e.g., WoSIS, etc.). Soil C stocks in organic-rich wetlands were clearly not well-constrained by %OC (Figure 3), necessitating better assessments of wetland soil bulk density both within the US, and likely globally. The unique settings and sampling needs for wetland soil characterization suggest that targeted sampling (EPA NWCA) or community contributed datasets (CCRCN, ISCN) of wetland soils provide critical observations necessary for modeling wetland soil carbon stocks and vulnerability. This is especially apparent in the EMU woody organic soils, which represent 2.3 Pg of the entire 9.4 Pg of CONUS in our analysis, but 3.2 Pg in the SSURGO-based stock analysis (Table 4). Our clear representation of uncertainty encompasses other estimates [13.5 Pg C (12), 11.5 Pg C, (14); 8.9 Pg, (13)], but identifies an overestimation bias due to the need for better bulk density representation in organic soil wetland settings (Supplemental Table 2.5).
Any biases and limitations are further extrapolated when spatial products at continental scales are ingested into gridded global products. WoSIS, for example, poorly represents organic soils, despite its voluminous ingestion of spatial data layers (20). Wetland soils, as discontinuous components on the landscape, are poorly represented by spatial interpolation between samples and will benefit from greater attention to subsurface and historic processes.
There are many benefits to modeling SOC density based on %OC alone which can be applied to other global datasets. One of these is that the relationship between SOC and %OC was consistent across wetland types in CONUS, both inland and tidal. The model accuracy and range were similar regardless of which region they are found. Because of this empirical approach, it is possible to use the same model development techniques for soils in other regions with survey and wetland-specific samples of %OC—whether measured directly or modeled from percent organic matter (%OM). Field sampling of %OM through loss-on-ignition (41) is a common approach worldwide and does not require special extraction and transportation the way bulk density measurements do. This quantile-based model also has the advantage of a more robust methodology that is less sensitive to the unusually high or low values that are inevitable with field data, and bias fully parametric techniques such as a segmented linear least squares model. Additionally, the NWCA data set used for this model development is periodically updated (2016 data currently being shared, and 2021 data collection being planned). Our approach can be updated to reflect changes in %OC values, improved bulk density collections, changes in sea level and coastal wetland locations, and changes to mappable features of wetland location, landcover, and extent. This method also allows researchers to split soils into categories of varied confidence: highly predictable mineral soils with a linear growth of SOC density with %OC (mineral section, %OC <6) and less predictable organic soils with difficult to characterize and highly variable bulk densities above the mineral: organic cutoff (%OC > 6).
Conclusion
CONUS wetland soils were mapped at 30 m resolution in layers for each 10 cm depth increment down to 100 cm. The most parsimonious model split CONUS wetlands into only two geographic zones: “inland” wetlands and “tidal” (coastal) wetlands based on physical location associated with a spatial inland/tidal boundary identified by Holmquist et al. (35). Mineral and organic soil types were clearly isolated by a broken stick model for “mineral” and “organic” soil carbon stocks. Spatial disaggregation by landcover, region, salinity and relative elevation (in tidal portions) was found to be unhelpful in addressing accuracy or precision. Our harmonized CONUS wetland soil map, with mean and standard error distributions, was found to replicate results commonly observed in mineral-rich wetland soils, but our analysis illuminates at least three significant findings for organic wetland soil carbon stock monitoring. First, SOC stocks for organic-rich soils (>6% OC by weight) were similar downcore in the 0–100 cm profile, illustrating similar preservation mechanisms with depth below the soil surface, and thus limited physical stabilization for protection from microbial activity associated with temperature, priming, or hydrologic disturbance. Second, these SOC stocks show a wide range of SOC densities which were not predictable by region or vegetation type, thus identifying a need for a mappable characterization to improve accuracy by a more functional disaggregation. Third, mean values for SOC density in organic wetland soils were 35% lower in our analysis than reported with SSURGO-based estimates. Whereas, SOC stocks in mineral-rich wetlands were relatively well-constrained by %OC (an index of organic matter content), SOC stocks in organic-rich wetlands were not, necessitating better assessments and characterization of organic-rich soils which represent a high fraction of wetland SOC stock uncertainty within the CONUS, and likely globally. The unique settings and sampling needs for wetland soil characterization suggest that targeted sampling or community contributed wetland soil datasets can provide critical observations necessary for assessing wetland SOC stocks and modeling their vulnerability.
Data Availability Statement
Publicly available datasets were analyzed in this study. This data can be found here: https://data.nal.usda.gov/dataset/soil-survey-geographic-database-ssurgo, https://www.epa.gov/national-aquatic-resource-surveys/national-wetland-condition-assessment-2011-results, https://www.mrlc.gov/data/nlcd-2011-land-cover-conus-0, https://serc.si.edu/coastalcarbon/data.
Author Contributions
BU preformed analysis in R, ArcGIS/Python and led model draft development with supervision from LW-M, who also guided development process. NB prepared SSURGO rasters and provided guidance on GIS processes. AMN organized and cleaned NWCA data and provided guidance on use and interpretation. ES provided guidance on modeling approaches and development. CS organized the project and helped interpret findings. All authors contributed to the article and approved the submitted version.
Funding
This project was funded through the U.S. Geological Survey's Land Carbon Program and a grant to ES through the U.S. Geological Survey's Community for Data Integration Program for generating cross-agency assessments.
Author Disclaimer
The NWCA was planned, funded, and organized by the US EPA's Office of Water and Office of Research and Development, and carried out by numerous state, federal, and contractor field crews; information management staff; and laboratory staff whose efforts we gratefully acknowledge. Raw data collected as part of the 2011 NWCA are publicly available at https://www.epa.gov/national-aquatic-resource-surveys/nwca. This manuscript has been subjected to EPA review and has been approved for publication. The views expressed in this paper are those of the authors and do not necessarily reflect the views or policies of the US EPA. Mention of trade names or commercial products does not constitute endorsement or recommendation for use.
Conflict of Interest
The authors declare that the research was conducted in the absence of any commercial or financial relationships that could be construed as a potential conflict of interest.
Publisher's Note
All claims expressed in this article are solely those of the authors and do not necessarily represent those of their affiliated organizations, or those of the publisher, the editors and the reviewers. Any product that may be evaluated in this article, or claim that may be made by its manufacturer, is not guaranteed or endorsed by the publisher.
Acknowledgments
We gratefully acknowledge review comments from the U.S. Geological Survey, and from three journal-selected reviewers. Colleague review and funding from the USGS LandCarbon Program were essential to producing this harmonized product, as was summer assistance from Georgia Richter (A.C. Flora High School, South Carolina).
Supplementary Material
The Supplementary Material for this article can be found online at: https://www.frontiersin.org/articles/10.3389/fsoil.2021.706701/full#supplementary-material
Footnotes
1. ^World Soil Information Service SoilGrid 250 2.0, soilgrids.org. Accessed at https://www.isric.org/explore/wosis.
References
1. Page SE, Baird AJ. Peatlands and global change: response and resilience. Ann Rev Environ Resour. (2016) 41:35–57. doi: 10.1146/annurev-environ-110615-085520
2. Moomaw WR, Chmura GL, Davies GT, Finlayson CM, Middleton BA, Natali SM, et al. Wetlands in a changing climate: science, policy and management. Wetlands. (2018) 38:183–205. doi: 10.1007/s13157-018-1023-8
3. Bridgham SD, Megonigal JP, Keller JK, Bliss NB, Trettin C. The carbon balance of North American wetlands. Wetlands. (2006) 26:889–916. doi: 10.1672/0277-5212(2006)26[889:TCBONA]2.0.CO;2
5. IPCC. 2013 Supplement to the 2006 IPCC Guidelines for National Greenhouse Gas Inventories: Wetlands. Hiraishi T, Krug T, Tanabe K, Srivastava N, Baasansuren J, et al. Published: IPCC, Switzerland (2014).
6. Raich JW, Schlesinger WH. The global carbon dioxide flux in soil respiration and its relationship to vegetation and climate. Tellus B. (1992) 44:81–99. doi: 10.3402/tellusb.v44i2.15428
7. Laanbroek HJ. Methane emission from natural wetlands: interplay between emergent macrophytes and soil microbial processes. A mini-review. Ann Bot. (2010) 105:141–53. doi: 10.1093/aob/mcp201
8. Moseman-Valtierra S, Gonzalez R, Kroeger KD, Tang J, Chao WC, Crusius J, et al. Short-term nitrogen additions can shift a coastal wetland from a sink to a source of N2O. Atmos Environ. (2011) 45:4390–7. doi: 10.1016/j.atmosenv.2011.05.046
9. Kroeger KD, Crooks S, Moseman-Valtierra S, Tang J. Restoring tides to reduce methane emissions in impounded wetlands: a new and potent Blue Carbon climate change intervention. Sci Rep. (2017) 7:11914. doi: 10.1038/s41598-017-12138-4
10. Huang Y, Ciais P, Luo Y, Zhu D, Wang Y, Qiu C, et al. Tradeoff of CO2 and CH4 emissions from global peatlands under water-table drawdown. Nat Clim Change. (2021) 11:618–22. doi: 10.1038/s41558-021-01059-w
11. Lajtha K, Bailey V, McFarlane K. The Second State of the Carbon Cycle Report-Chapter 12. Soils. In: Cavallaro N. Shrestha G, Birdsey R, Mayes MA, Najjar RG, Reed SC, P. Romero-Lankao, and Z. Zhu, editors. Second State of the Carbon Cycle Report (SOCCR2): A Sustained Assessment Report. U.S. Global Change Research Program, Washington, DC. USA (2018). p. 469–506
12. Kolka R, Trettin C, Tang W, Krauss K, Bansal S, Drexler J, et al. Chapter 13: Terrestrial wetlands. In Second State of the Carbon Cycle Report (SOCCR2): A Sustained Assessment Report. In: Cavallaro N, Shrestha G, Birdsey R, Mayes MA, Najjar RG, Reed SC, P. Romero-Lankao, and Z. Zhu, editors. U.S. Global Change Research Program. Washington, DC (2018). p. 507–67
13. Bliss NB, Waltman SW, West LT, Neale A, Mehaffey M. Distribution of soil organic carbon in the conterminous United States. In: Soil Carbon. Springer, Cham (2014). p. 85–93. doi: 10.1007/978-3-319-04084-4_9
14. Nahlik AM, Fennessy MS. Carbon storage in US wetlands. Nat Commun. (2016) 7:13835. doi: 10.1038/ncomms13835
15. Wills S, Loecke T, Sequeira C, Teachman G, Grunwald S, West L. Overview of the U.S. Rapid Carbon Assessment project: Sampling design, initial summary and uncertainty estimates. In: Hartemink AE, McSweeney K, editors. Soil Carbon. Cham: Springer International Publishing (2014). p. 95–104. doi: 10.1007/978-3-319-04084-4_10
16. Abdelbaki AM. Evaluation of pedotransfer functions for predicting soil bulk density for U.S. soils. Ain Shams Eng J. (2018) 9:1611–9. doi: 10.1016/j.asej.2016.12.002
17. Malhotra A, Todd-Brown K, Nave LE, Batjes NH, Holmquist JR, Hoyt AM, et al. The landscape of soil carbon data: emerging questions, synergies and databases. Prog Phys Geogr. (2019) 43:707–19. doi: 10.1177/0309133319873309
18. Mitra S, Wassmann R, Vlek PL. An appraisal of global wetland area and its organic carbon stock. Curr Sci. (2005) 88:25–35. Available online at: https://www.researchgate.net/profile/Paul-Vlek/publication/255613109_An_Appraisal_of_Global_Wetland_Area_and_Its_Organic_Carbon_Stock/links/004635371404857090000000/An-Appraisal-of-Global-Wetland-Area-and-Its-Organic-Carbon-Stock.pdf
19. Batjes NH, Ribeiro E, van Oostrum A, Leenaars J, Hengl T, de Jesus JM. WoSIS: providing standardised soil profile data for the world. Earth Syst Sci Data. (2017) 9:1–14. doi: 10.5194/essd-9-1-2017
20. Harden JW, Hugelius G, Ahlström A, Blankinship JC, Bond-Lamberty B, Lawrence CR, et al. Networking our science to characterize the state, vulnerabilities, and management opportunities of soil organic matter. Glob Chang Biol. (2018) 2:e705–18. doi: 10.1111/gcb.13896
21. Hengl T, de Jesus JM, Heuvelink GB, Gonzalez MR, Kilibarda M, Blagotić A, et al. SoilGrids250m: global gridded soil information based on machine learning. PLoS ONE. (2017) 12:e0169748. doi: 10.1371/journal.pone.0169748
22. Arrouays D, McBratney A, Bouma J, Libohova Z, Richer-de-Forges AC, Morgan CL, et al. Impressions of digital soil maps: the good, the not so good, and making them ever better. Geoderma Reg. (2020) 20:e00255. doi: 10.1016/j.geodrs.2020.e00255
23. Köchy M, Hiederer R, Freibauer A. Global distribution of soil organic carbon - Part 1: masses and frequency distributions of SOC stocks for the tropics, permafrost regions, wetlands, the world. Soil. (2015) 1:351–65. doi: 10.5194/soil-1-351-2015
24. Holmquist JR, Windham-Myers L, Bliss N, Crooks S, Morris J, Megonigal JP, et al. Accuracy and precision of soil carbon estimates for tidal Wetlands in the conterminous United States. Nat Sci Rep. (2018) 8:9478. doi: 10.1038/s41598-018-26948-7
25. Ramcharan A, Hengl T, Nauman T, Brungard C, Waltman S, Wills S, et al. Soil property and class maps of the conterminous United States at 100-meter spatial resolution. Soil Sci Soc Am J. (2018) 82:186–201. doi: 10.2136/sssaj.2017.04.0122
26. Kentula ME, Paulsen SG. The 2011 National Wetland condition assessment: overview and an invitation. Environ Monit Assess. (2019) 191:325. doi: 10.1007/s10661-019-7316-4
27. USDA. US Department of Agriculture. Natural Resources Conservation Service. Gridded National Soil Survey Geographic (gSSURGO) Database (2021). Available online at: https://www.nrcs.usda.gov/wps/portal/nrcs/detail/soils/survey/geo/?cid=nrcseprd1464625
28. US EPA. US Environmental Protection Agency. National Wetland Condition Assessment: Laboratory Operations Manual. EPA Publication 843-R-10-002 (2011). Available online at: http://water.epa.gov/type/wetlands/assessment/survey/index.cfm
29. Homer C, Dewitz JA, Yang L, Jin S, Danielson P, Xian G, et al. Completion of the 2011 National Land Cover Database for the Conterminous United States-Representing a Decade of Land Cover Change Information: Photogrammetric Engineering and Remote Sensing, Vol. 81. (2015). p. 345–54.
30. R Core Team. R: A language and environment for statistical computing. R Foundation for Statistical Computing, Vienna, Austria. (2013). Available online at: http://www.R-project.org./
31. US EPA. US Environmental Protection Agency. National Wetland Condition Assessment: Field Operations Manual. EPA Publication 843-R-10-001 (2011). Available online at: http://water.epa.gov/type/wetlands/assessment/survey/index.cfm
32. Holmquist JR, Windham-Myers L. Relative Tidal Marsh Elevation Maps with Uncertainty for Conterminous USA. 2010. ORNL DAAC, Oak Ridge, Tennessee, USA (2021). doi: 10.3334/ORNLDAAC/1844
33. Holmquist JR, Windham-Myers L, Bernal B, Byrd KB, Crooks S, Gonneea ME, et al. Coastal Wetland Elevation and Carbon Flux Inventory with Uncertainty, USA, 2006-2011. ORNL DAAC, Oak Ridge, Tennessee, USA (2019).
34. National Oceanic and Atmospheric Administration Office for Coastal Management. Coastal Change Analysis Program (C-CAP) Regional Land Cover. Charleston, SC: NOAA Office for Coastal Management. Available online at: www.coast.noaa.gov/htdata/raster1/landcover/bulkdownload/30m_lc/
35. Holmquist JR, Windham-Myers L, Bernal B, Byrd KB, Crooks S, Gonneea ME, et al. Uncertainty in United States coastal wetland greenhouse gas inventorying. Environ Res Lett. (2018) 13:115005. doi: 10.1088/1748-9326/aae157
36. Helsel DR, Hirsch RM. Statistical methods in water resources techniques of water resources investigations, Book 4, chapter A3. U.S. Geological Survey. (2002). p. 522. Available as PDF at: https://pubs.usgs.gov/twri/twri4a3/#pdf
37. Osland MJ, Gabler CA, Grace JB, Stagg CL, Day RH, Hartley SB, et al. U.S. Golf of Mexico Coast (TX, MS, AL, and FL) Macroclimate Landscape and Climate Data 2013–2014 (2016).
38. Adhikari K, Owens PR, Libohova Z, Miller DM, Wills SA, Nemecek J. Assessing soil organic carbon stock of Wisconsin, USA and its fate under future land use and climate change. Sci Total Environ. (2019) 667:833–45. doi: 10.1016/j.scitotenv.2019.02.420
39. Fargione JE, Bassett S, Boucher T, Bridgham SD, Conant RT, Cook-Patton SC, et al. Natural climate solutions for the United States. Sci Adv. (2018) 4:eaat1869. doi: 10.1126/sciadv.aat1869
40. Brady NC, Weil RR, Weil RR. The Nature and Properties of SoilsVol. 13. Upper Saddle River, NJ: Prentice Hall (2008). p. 662–710.
Keywords: soil organic carbon, soil carbon density, wetland, organic matter, soil profile, soil carbon stock vulnerability
Citation: Uhran B, Windham-Myers L, Bliss N, Nahlik AM, Sundquist ET and Stagg CL (2021) Improved Wetland Soil Organic Carbon Stocks of the Conterminous U.S. Through Data Harmonization. Front. Soil Sci. 1:706701. doi: 10.3389/fsoil.2021.706701
Received: 07 May 2021; Accepted: 10 September 2021;
Published: 12 October 2021.
Edited by:
Benjamin N. Sulman, Oak Ridge National Laboratory (DOE), United StatesReviewed by:
Gerardo Moreno, University of Extremadura, SpainAndrew R. Jones, University of California, Berkeley, United States
Copyright © 2021 Uhran, Windham-Myers, Bliss, Nahlik, Sundquist and Stagg. This is an open-access article distributed under the terms of the Creative Commons Attribution License (CC BY). The use, distribution or reproduction in other forums is permitted, provided the original author(s) and the copyright owner(s) are credited and that the original publication in this journal is cited, in accordance with accepted academic practice. No use, distribution or reproduction is permitted which does not comply with these terms.
*Correspondence: Bergit Uhran, buhran@utk.edu; Eric T. Sundquist, esundqui@usgs.gov
†ORCID: Bergit Uhran orcid.org/0000-0003-2074-5248
Lisamarie Windham-Myers orcid.org/0000-0003-0281-9581
Norman Bliss orcid.org/0000-0003-2409-5211
Amanda M. Nahlik orcid.org/0000-0003-0591-375X
Eric T. Sundquist orcid.org/0000-0002-1449-8802
Camille L. Staggt orcid.org/0000-0002-1125-7253