


1. Introduction
With its varied landscape of hills and mountains, New Zealand has an abundance of marginal land, which tends to have significant physical limitations like steep slopes and low ability to support productive uses (Lynn et al. Reference Lynn, Manderson, Page, Harmsworth, Eyles, Douglas, Mackay and Newsome2009). This land is currently used in a variety of enterprises, such as pasture and farmland; but it is also associated with higher rates of erosion, shallow topsoil, expensive fencing, and environmental externalities (Lambie et al. Reference Lambie, Awatere, Daigneault, Kirschbaum, Marden, Soliman and Walsh2021; Tran et al. Reference Tran, Pearson, Palmer, Gray, Lowry and Dominati2022). There is currently interest in deploying these marginal lands to different uses to align with several environmental and production-related goals.Footnote 1 The government aims to reduce emissions and expand agricultural and primary industry production, which will involve important trade-offs. For instance, several local sources have had success with exotic forestry and Manuka production, which provide important ecosystem services. Both exotic plantation forestry operations and indigenous afforestation represent carbon sinks, with several important trade-offs in marginal costs, production revenue, and complementary ecosystem services.
This paper contributes to the discussion on marginal land by exploring several of the central costs and benefits of different land options. To illustrate these impacts, we use several data sets from an area of the Manawatu–Whanganui Region, at the bottom of the North Island. The area has historically had forestry and pasture as primary sources of employment, and contains large areas classified as hill country. The area therefore faces several notable environmental issues, such as erosion and nutrient runoff from farming.
Economic and environmental modeling are combined with environmental valuation to analyze three different scenarios related to afforestation in the Manawatu area. The combination of these tools and data sets allows us to produce several important quantitative and qualitative outputs. Where possible, quantitative predictions are monetized, allowing a benefit-cost analysis of the proposed scenarios. One scenario replaces all existing marginal land with exotic (Pinus Radiata) forestry. The second uses indigenous forestry instead, allowing honey production on some of the land.
We model several important outcomes related to each of these two scenarios, including several ecosystem services associated with afforestation, as well as opportunity costs associated with land conversion. After using several spatial resources and models to identify potential marginal land for our afforestation scenarios, we use benefit transfer to assign nonmarket values where possible. Overall, we find that our two scenarios have net benefits. This is important to qualify, however, since there are several important benefit categories, such as cultural services, which were not monetized in this analysis.
2. Methods
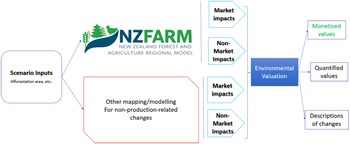
This paper uses a mix of economic modeling, market, and nonmarket impact assessment, and environmental valuation to quantify the potential effects of two afforestation scenarios in the Manawatu catchment, New Zealand. An overview of the study framework is presented in Figure 1. More details on each component are provided below.

Figure 1. Manawatu catchment afforestation study framework.
2.1 Study site and marginal lands
Due to the prevalence of marginal lands in New Zealand, there have been concerns about its use for many years. A symposium by the Royal Society of New Zealand in 1951 on Forestry and Marginal lands gave the following definition “those lands which over a long period of years would yield sufficient production to constitute an economic gain to the nation if developed, but from which the return over a short period would not be sufficient to enable the ordinary individual farmer to carry out the development.” Footnote 2 Meanwhile, the current OECD definition is: “land of poor quality with regard to agricultural use, and unsuitable for housing and other uses.” Footnote 3
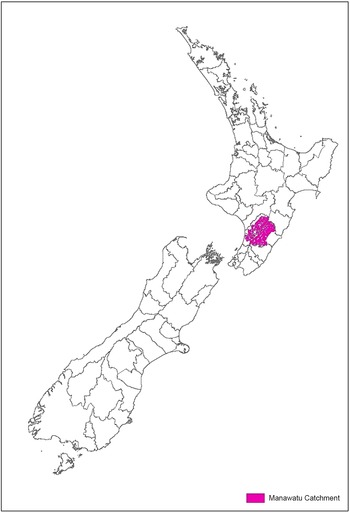
The Manawatū catchment is located in the Manawatū-Wanganui Region in the North Island (Figure 2). Most of the Manawatū catchment is covered by pasture, as much of the original indigenous forest has been cleared for farming over the last 150 years or so. The clearing of the indigenous forest has led to erosion and other problems on steep slopes in the area (Ausseil et al. Reference Ausseil, Dymond, Kirschbaum, Andrew and Parfitt2013). The Manawatū catchment overlaps some of the area of six Territorial Authorities (TA): Central Hawke’s Bay, Horowhenua, Manawatū, Masterton, Palmerston North City, and Tararua.

Figure 2. Manawatu catchment, North Island, New Zealand.
2.2 Afforestation potential
We drew heavily from maps produced by Watt et al. (Reference Watt, Palmer and Hock2011) to identify areas of marginal land most suitable for afforestation. This earlier work identified three potential options for afforestation, depending on assumptions about land suitability which was based on land use capability classes. Footnote 4 For all our analysis, we use the first scenario of Watt et al. (Reference Watt, Palmer and Hock2011), which represents the most conservative assumptions on areas suitable for afforestation – and has the smallest afforestation area of the three options. That land is less likely to face competition for other higher-value agricultural uses, and it is therefore the least disruptive policy option.
To identify the new afforestation areas, high-resolution GIS data sets are used that cover land use, terrain attributes, and a range of environmental variables. The primary data source was the New Zealand Land Cover Database (LCDB), which is a digital map of land cover created by grouping together similar classes that were identified from satellite images. Footnote 5 Note that we omit all conservation and reserve land from the analysis, as it is highly unlikely that those lands would be converted.
2.2.1 Natural afforestation
We also explored the potential of these lands for natural afforestation. In some areas of New Zealand, active afforestation is required for indigenous forest. The probability of natural reversion depends on landscape and location-based factors. We use models from Mason et al. (Reference Mason, Ausseil, Dymond, Overton, Price and Carswell2012) to identify areas of active afforestation. Mason et al. (Reference Mason, Ausseil, Dymond, Overton, Price and Carswell2012) selected 10,061 plot surveys from New Zealand’s National Vegetation Survey Databank conducted between 1982 and 2008 and analyzed them to identify central environmental and land cover influences that affect the occurrence probability of indigenous vegetation. LCDB also played a central role in this effort, in addition to a range of environmental and land cover GIS data sets. Mason et al. (Reference Mason, Ausseil, Dymond, Overton, Price and Carswell2012) found that the most important environmental variable was mean annual temperature, while the most predictive land cover variables were local woody cover and distance to forest. Following this, we estimate that the Manawatu is quite suitable for indigenous afforestation, with only a few hectares in the southwest of the region needing active afforestation (less than 4 ha of identified afforestation areas were identified as needing active planting, so for our purposes this was assumed to be effectively zero).
2.2.2 Mānuka and Kānuka suitability
Honey production has received significant attention in New Zealand due to the recent expansion of Mānuka honey products. In addition to its use as a luxury sweetener, Mānuka honey has antibacterial properties that lend it to several surgical and medical applications. Very high-grade honey can sell for a significant premium over traditional honey. The number of registered beekeeping enterprises rose from 3,267 in 2011 to 6,735 in 2016. Footnote 6 Due to this rapidly increasing production, which depends on indigenous trees, we model the potential for the afforestation land to support Mānuka operations.
We adapted the work of Watt (Reference Watt2012) as they included a predictive model of those two species. The growth of Mānuka/Kānuka stands was modeled using a physiologically based growth model (CenW 4.0) that explored the relationship of Mānuka/Kānuka stands to environmental conditions and other related factors. Mean annual temperature and precipitation were identified as the best predictors, with Mānuka/Kānuka completely absent from sites below 5°C. Therefore, we used the temperature and precipitation prediction equations from Watt (Reference Watt2012) to define the probability of occurrence of Mānuka/Kānuka as a function of temperature and precipitation. Footnote 7
For temperature:
 $$\Pr \left( {Occur_{Temp}^{}} \right) = 7.159\times TempC - 30.734$$
where TempC is the mean annual temperature in degrees Celsius, and Pr(OccurTemp) is the probability of Mānuka/Kānuka occurrence, based on temperature.
For precipitation (prec), where mean annual precipitation is below 1,550 mm/yr:
 $$\Pr \left( {Occur_{Rain}^{}} \right) = 0.06\times prec \times prec- 16.5$$
For annual precipitation greater than 1,550 mm/yr:
 $$\Pr \left( {Occur_{Rain}^{}} \right) = - 2x\left( {{E^{ - 10}}} \right)\times pre{c^3} + 5\left( {{E^{ - 6}}} \right)\times prec^2 - 0.0418\times prec\, + 119.57$$
In areas where the probability is based on precipitation and temperature, both of which are greater than 50%, the land is designated as having the potential for Mānuka/Kānuka stands.
2.3 Ecosystem services classification
To better evaluate the full range of costs and benefits for the afforestation scenarios, we use the ecosystem services classification (MA 2005). The Millennium Ecosystem Assessment (MA) Footnote 8 defined ecosystem services as “the benefits people obtain from ecosystems,” which the MA classifies as provisioning, regulating, supporting, and cultural services. Provisioning services include the direct products from ecosystems that people use. Many of the agricultural products, such as meat, milk, and honey fit into this category (MA 2005). According to Statistics NZ, approximately 8 percent of New Zealand’s GDP was derived from primary industries in 2009, which includes agriculture, fishing, forestry, and mining, illustrating the large amount of resources dependent on these ecosystem services. Regulating services include the impacts from the ecosystem people obtain that help regulate ecosystem processes, such as the regulation of air pollution by trees, the control of erosion by tree roots, and the purification of water by plants (MA 2005).
Native and exotic afforestation can produce a range of ecosystem services. Both types of forest sequester carbon, and both types can be used for timber harvest, but Indigenous timber harvest is much less common. Footnote 9 Roughly, 80% of the country’s indigenous forests are publicly owned, with the remaining privately owned land under strict sustainable harvesting limits and policies (McGlone et al. Reference McGlone, Bellingham and Richardson2022). Footnote 10 Yao et al. (Reference Yao, Barry, Wakelin, Harrison, Magnard, Payn and Dymond2016) summarize the current state of exotic forests across New Zealand and describe the provisioning, regulating, cultural, and supporting ecosystem services provided by them. There are over 200 native tree species in New Zealand, which vary significantly across the different ecoregions of the two islands (Allen et al. Reference Allen, Bellingham, Holdaway, Wiser and Dymond2016). There are ongoing efforts to increase Māori ownership of indigenous forests, with emphasis on kaitiakitanga (guardianship) and mātauranga (traditional knowledge) (Allen et al. Reference Allen, Bellingham, Holdaway, Wiser and Dymond2016).
Given the important role of forests in New Zealand, there have been several past efforts to value their services. Kotula (Reference Kotula2022) summarizes past valuation literature in New Zealand and provides an overview of some of the central benefits associated with forests in New Zealand, including carbon sequestration, recreation, habitat, biodiversity, and cultural services. Footnote 11 Out of 17 studies in their paper, ranging from 1983 to 2019, biodiversity and recreation were the most common focus, with six studies each. Contingent valuation was the most common valuation method, with 5 studies using it, followed by choice modeling/discrete choice (4) travel cost (4), real options/optimization (2), and other approaches (2). Tuahine (Reference Tuahine2018) summarizes some of the additional benefits of native forest, including Manuka honey, erosion control, water quality, tourism, recreational use, biodiversity, and habitat.
Cultural services are the nonmaterial benefits that people receive from ecosystems (MA 2005). New Zealand has a variety of sites that have specific cultural significance to many people, and rapid landscape change is likely to affect these values. There are many areas with a history of spiritual practices, experiences, and values that depend on the composition of the landscape. For instance, historic vistas might be significantly altered by large exotic forestry plantations. In elevated, erosion-prone areas these areas’ visibility may be quite expansive. A transition from pasture farming to forestry may also affect farming lifestyle and the associated cultural experience. Similarly, the degradation/improvement in water quality from changing land uses will affect cultural values.
Recreation-related benefits were recently found to have a very high value in Turner et al. (Reference Turner, Dhakal, Yao, Barnard and Maunder2011), although those benefits were related to mountain biking and walking trails, which were quite unique to the setting of their study. Similarly, Dhakal et al. (Reference Dhakal, Yao, Turner and Barnard2012) have estimated the economic value of recreation activities in Rotorua’s Whakarewarewa forest in New Zealand. They found that walking and mountain biking were valued at NZ$8 million per year. Finally, supporting services are seen as inputs into the other ecosystem services categories, which can be necessary for their production. For instance, the provision of habitat for pollinators is a necessary input to a range of agricultural products.
Yao et al. (Reference Yao, Scarpa, Harrison and Burns2019) use estimates from a past studies in a simplified benefit transfer that compares the benefits and costs of biodiversity. Footnote 12 The paper provides a wealth of information on biodiversity values in New Zealand forests, as well as evidence for people’s willingness to pay (WTP) for biodiversity improvements. New Zealand’s endemic species are very unique, with significant government funds dedicated to conservation. Footnote 13 This reflects significant public interest in protecting indigenous species, as illustrated by past nonmarket valuation studies (Dymond et al. Reference Dymond, Ausseil, Kirschbaum, Carswell and Mason2013; Tait et al. Reference Tait, Saunders, Nugent and Rutherford2017; Yao et al., Reference Yao, Scarpa, Turner, Barnard, Rose, Palma and Harrison2014).
2.4 Economic and ecosystem service analysis
The economic analysis is conducted using a spatially explicit agri-environmental economic land use model (NZFARM) and nonmarket valuation methods to monetize changes in land use based on varying afforestation scenarios. Opportunity costs from conversion of current land to forests were estimated as changes in net land revenue or earnings before interest and tax (EBIT) in NZFARM. More details on NZFARM are provided in Daigneault et al. (Reference Daigneault, Greenhalgh and Samarasinghe2018). All monetary values in this analysis are reported in 2017 New Zealand dollars (NZD).
2.4.1 Mānuka/Kānuka honey
Estimating honey revenue is difficult, as there is limited information on the profitability of honey production in New Zealand. There also appears to be significant variability in profits and honey quality. Footnote 14 For our analysis, we use information gathered from trade associations and beekeepers by Daigneault et al. (Reference Daigneault, Wright and Samarasinghe2015) to estimate the EBIT from honey. Footnote 15 Based on that report, we developed three profitability types for honey production. The least profitable honey operation is a self-managed operation. The next most profitable operation involves hiring a beekeeper, which is marginally more profitable than a self-managed operation. The most profitable honey operation involves the use of a beekeeper and the production of high unique Manuka factor (UMF). There is unfortunately a dearth of information in the literature and from the trade associations about predicting UMFDiscussions with Apiculture New Zealand indicated that some of the central influences on UMF include past history. Footnote 16
Since several of those factors are included in the Watt (Reference Watt2012) prediction equations we use to identify land suitable for Mānuka/Kānuka, we have adapted them to predict the potential of honey operations. Those equations produce probability scores for each area on the ability to support Mānuka. As a fairly conservative assumption, we assume that only the 99th percentile of Mānuka afforestation areas, in terms of rainfall and temperature probability, are suitable for high UMF production. The remaining area with Mānuka is assumed to be split between the other two profitability types.
2.4.2 Water quality valuation
Increased afforestation will affect several important regulating ecosystem services, such as water quality and water quantity. Water quality should improve as land is converted from agricultural uses to forested land. Afforesting land can improve water quality by reducing nutrient runoff and mitigating erosion (Hu et al. Reference Hu, Tian, Zhang, Benoy, Badreldin, Xing, Luo and Zhang2022). It can also prevent excess stormwater runoff and slow down flood flows leading to reduction in flood damage (Thomas and Nisbet Reference Thomas and Nisbet2016). In addition, afforestation can provide drought mitigation service by conserving water in dry season (Pattanayak and Kramer Reference Pattanayak and Kramer2001). On the other hand, afforestation in temperate places like New Zealand is likely to reduce water yield, meaning there may be less water available for irrigation and other activities (Ausseil et al. Reference Ausseil, Dymond, Kirschbaum, Andrew and Parfitt2013, Filoso et al. Reference Filoso, Bezerra, Weiss and Palmer2017; Hua et al. Reference Hua, Bruijnzeel, Meli, Martin, Zhang, Nakagawa, Miao, Wang, McEvoy, Peña-Arancibia and Brancalion2022). Due to data and time constraints for this analysis, we focus primarily on the changes in water quality. There are also several sources of uncertainty about the changes in water quantity, as well as the sign and magnitude of their effects. On one hand, it may be more expensive for farmers to irrigate their crops. However, that may only have an impact at certain levels of existing water which are hard to predict. On the other hand, recent literature indicates that citizens may have a positive WTP for water going to forests instead of to agriculture (Baskaran et al. Reference Baskaran, Cullen and Colombo2009).
To value the benefits of water quality improvements, we employ a benefit transfer approach. Benefit transfers use estimated nonmarket values from a study (or studies) to evaluate another area or policy (Freeman Reference Freeman2003). Benefit transfer is commonly employed when time or budget constraints prevent original analysis. Although there are a variety of water quality valuation in the US and Europe, the New Zealand literature is much thinner (Barry et al. Reference Barry, Yao, Harrison, Paragahawewa and Pannell2014). There are several different types of benefit transfers, including unit transfers, function transfers, and meta-analysis function transfers (US EPA 2014).
We use a function transfer, which allows us to correct for the characteristics of the local population. Function transfers are generally recommended over unit transfers, as they allow for some correction between the population of the original study and that of the site the values are being transferred to (US EPA 2014). Unfortunately, there are not enough water quality valuation studies in New Zealand that use comparable measures of water quality, to construct a meta-analysis function transfer solely based on New Zealand studies.
In choosing water quality valuation studies for benefit transfer, there are several central criteria. Most important, the studies must use water quality parameters that match the outputs of our policy simulations. From NZFARM, we have data on the projected reduction in nutrient loadings, so studies that value changes in nutrients are ideal. We are also looking for stated preference studies in order to capture more aspects of people’s WTP for water quality improvements. It is also important that the study is done in New Zealand, ideally in an area similar to the Manawatū.
To monetize these impacts, we use a recent study that estimated people’s WTP for improvements in three water quality parameters (Walsh et al. Reference Walsh, Guignet and Booth2022). Their econometric model estimates WTP values for each regional council in New Zealand, which allows us to tailor their results to the Manawatū area. We use TA median household income data from the 2013 New Zealand Census to derive incomes for the Manawatū catchment.
We calculate the total WTP for water quality changes at the TA level, based on the water quality outputs of NZFARM. To estimate the water quality benefits across a 50-year timeframe, we also need an estimate of population growth for each TA. For this, we base our population growth estimates on the most recent Census.
To estimate the greenhouse gas reduction (i.e., climate regulation) benefits over 50 years, we need to know the emissions transition path rather than the steady-state levels. In the absence of forest modeling to forecast the time paths for the afforestation scenarios (which are beyond the scope of this analysis), we use the 2015 New Zealand Ministry for Primary Industries ETS lookup tables Footnote 17 to estimate the growth of various tree species, including Pinus radiata and indigenous species. The lookup tables provide carbon sequestration rates for different regions of New Zealand.
For changes in biodiversity, we employ a measure of “ecological integrity.” This measure was originally defined by Lee et al. (Reference Lee, Mcglone and Wright2005) as “the full potential of indigenous biotic and abiotic factors, and natural processes, functioning in sustainable communities, habitats, and landscapes” Carswell et al. (Reference Carswell, Mason, Overton, Price, Burrows and Allen2015). Indicators of ecological integrity are now widely employed, and the New Zealand Department of Conservation uses ecological integrity as their primary biodiversity goal. Our measure of ecological integrity is based on catchment-scale natural regeneration of indigenous forests on agricultural lands and has been used in several recent papers (Carswell et al. Reference Carswell, Mason, Overton, Price, Burrows and Allen2015; Mason et al. Reference Mason, Ausseil, Dymond, Overton, Price and Carswell2012, Reference Mason, Palmer, Vetrova, Brabyn, Paul, Willemse and Peltzer2016). The measure is called the “restored significance,” and it is a measure of the potential gain in environmental representation through natural regeneration. Larger restored significance values indicate that there is a larger potential increase in biodiversity from converting a particular plot of land to indigenous forest. This indicator is estimated at a 1 hectare grid and its units are parts per billion (ppb), where one billion represents the ideal ecological utopia of natural (pre-human) conditions (Carswell et al. Reference Carswell, Mason, Overton, Price, Burrows and Allen2015).
2.4.3 Cultural services and nonmonetized benefits
There are many important cultural services from forests, especially for Māori communities. By some estimates, roughly half of the commercially planted forests are owned by Māori. Footnote 18 There are also several options to protect indigenous forest land with government support, including the Māori Land Court and Ngā Whenua Rāhui covenants. Footnote 19 Native forest is seen as a central component of Māori whakapapa, or lineage (Pohatu et al. Reference Pohatu, O’Brien and Mercer2020). Miller et al. (Reference Miller, Dickinson and Reid2005) note that indigenous forests are important to Māori since they provide food, medicines, building materials, shelter, clothing, tools, and handicrafts, while “exotic commercial forestry” is the “adopted son” that provides employment, economic benefits, and the protection of lands. A good example of local cultural services from forests is rongoā, a traditional Māori healing system that includes plant-based medicines (rongoā rākau), spiritual prayers, and songs (karakia). Footnote 20 Pohatu et al. (Reference Pohatu, O’Brien and Mercer2020) describe recent work on engaging Māori communities to learn about their decisions to participate in native forestry. They recommend better tailoring government policy to respect and accommodate traditional methods of forestry. To compare cultural services and other nonmonetized benefits, we use estimates of potential impacts between native and exotic forests for several categories of benefits, based on recent literature. This allows an ordinal ranking of several benefit categories that could not be monetized.
2.5 Scenario analysis
This paper evaluates ecosystem service and economic impacts across two primary scenarios:
-
Scenario E: exotic (E) plantation forestry is planted on all new afforestation areas
-
Scenario I: new afforestation areas are afforested with permanent, nonrotation indigenous (I) forest. Where possible, land suitable for Mānuka/Kānuka in the new afforestation areas remains in Mānuka/Kānuka and is used for enterprises such as medical or commercial honey production.
3. Results
3.1 Afforestation potential
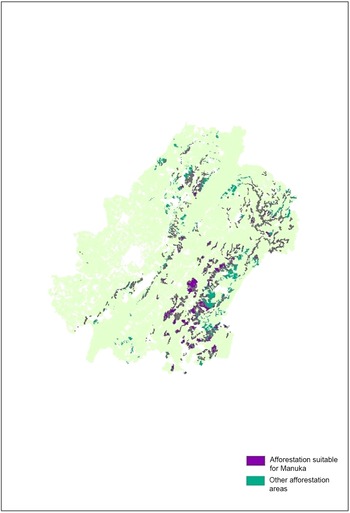
Approximately 39,400 ha of land were identified for new afforestation in the Manawatū catchment (Figure 3), where the most prevalent existing land use is sheep & beef, at approximately 31,600 ha. Of the almost 40,000 ha identified as new afforestation areas, approximately 24,000 ha are suitable for Mānuka/Kānuka. This was based on the probability thresholds that these areas can meet specific environmental (temperature and precipitation) conditions (Watt Reference Watt2012).
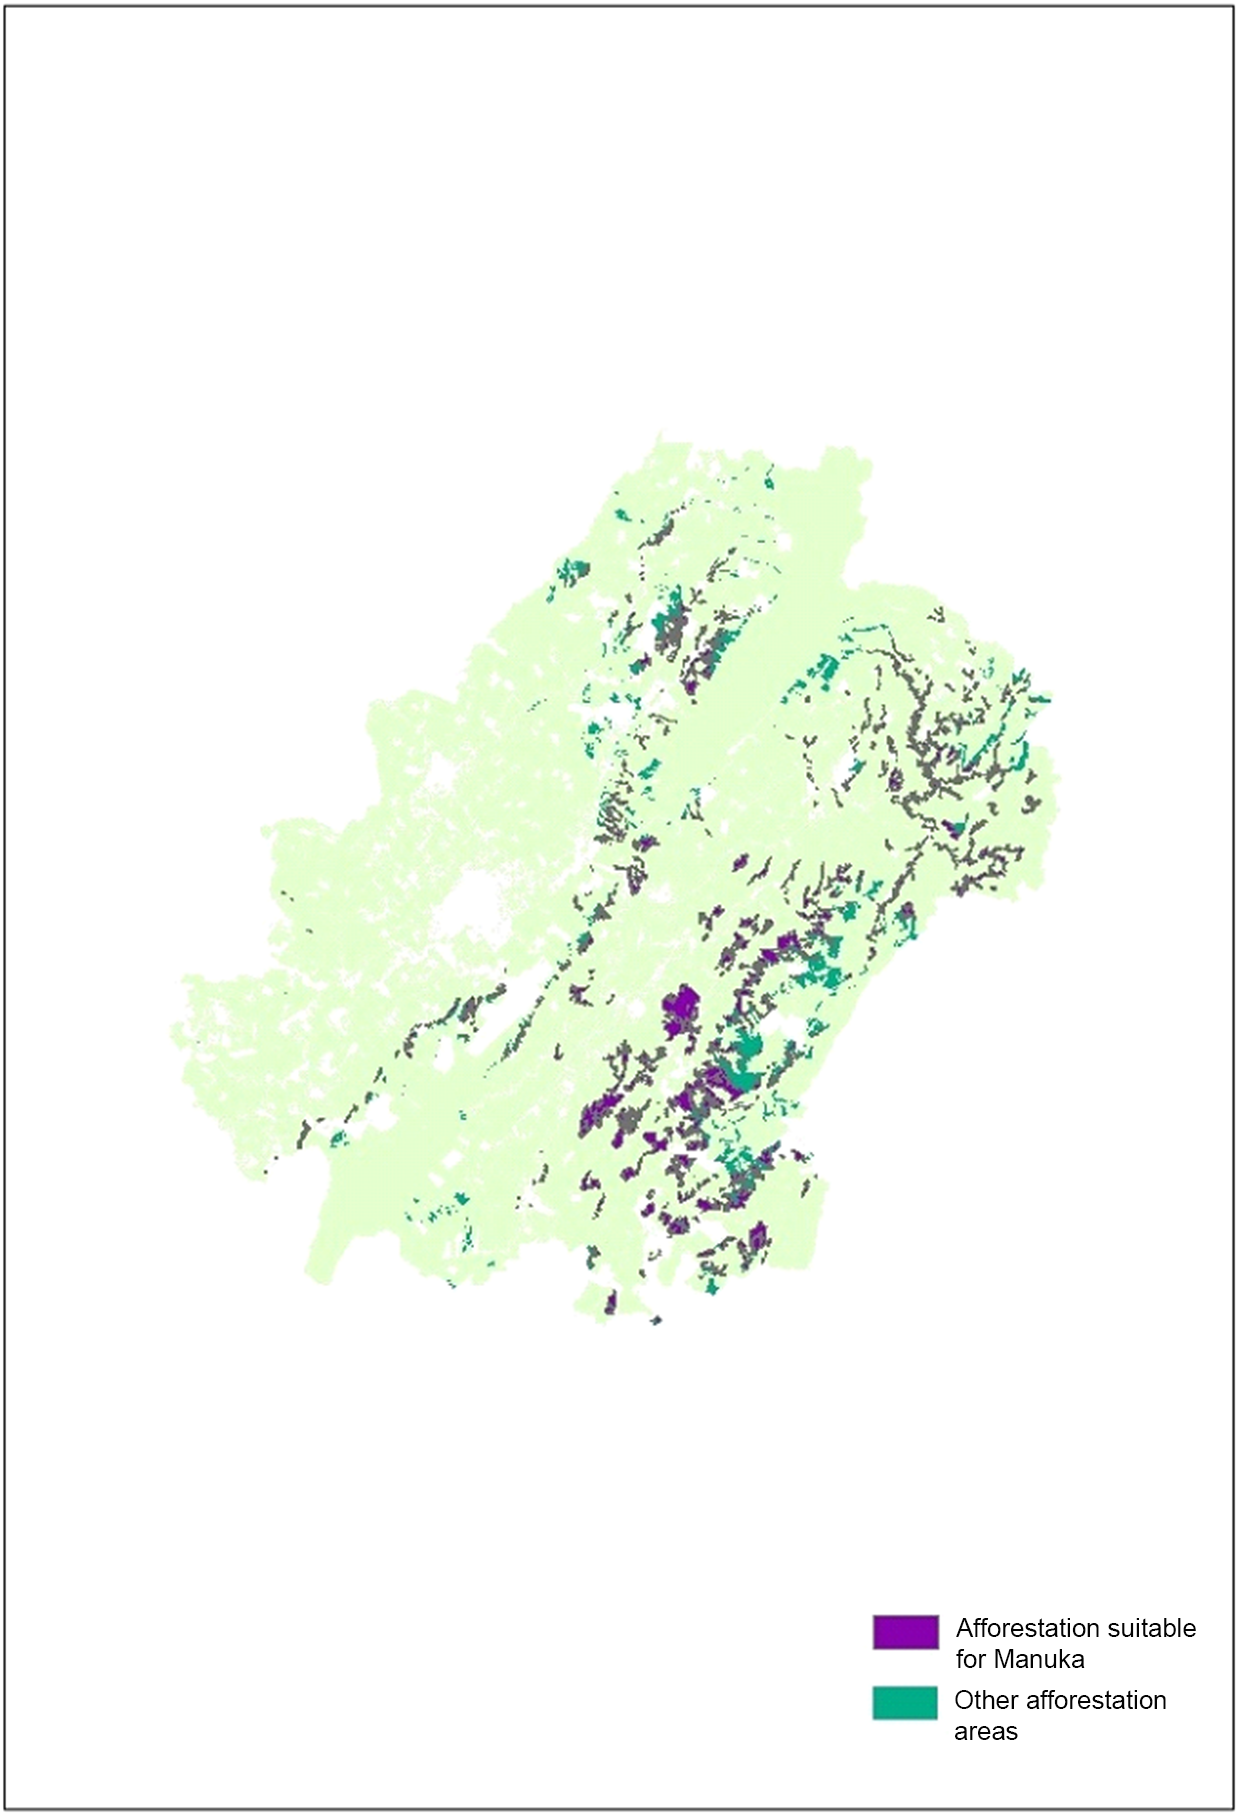
Figure 3. Areas suitable for afforestation in the Manawatu catchment.
3.2 Opportunity costs and afforestation revenue benefits
The opportunity cost of provisioning services from converted agricultural or forest land estimated in NZFARM for each of the scenarios is outlined in Table 1. The opportunity cost for the indigenous scenario represents the lost profits from the previous productive uses of the land. In the exotic scenario, the opportunity cost differs by the existing exotic forestry land, which is kept in that land use. The total opportunity cost for the catchment under Scenario E (exotic) is approximately $3.2 million/year in lost EBIT, with $3.6 million in Scenario I.
Table 1. Afforestation potential and opportunity costs from converting current provisioning services to forest in the Manawatū catchment, by territorial authority
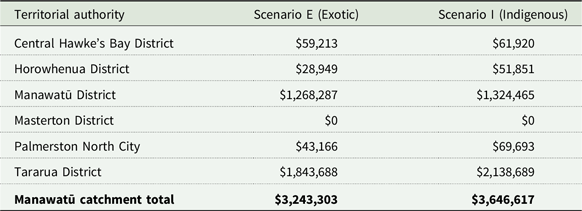
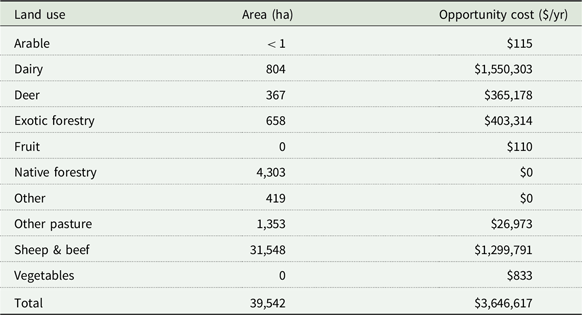
Table 2 shows the change in opportunity costs by previous land use. The highest land uses occupying the new afforestation areas are sheep & beef (31,548 ha), while dairy lands face the highest loss in net revenue ($1.6 million) due to its high baseline earning potential. The table also highlights a difference between Scenarios E and I: the exotic forestry is converted to indigenous in Scenario I; hence, the difference in opportunity costs of 400 thousand dollars.
Table 2. Area and annual opportunity costs for indigenous afforestation in Manawatū catchment, by current land use
The afforestation scenarios will result in several new streams of revenue, some of which we can quantify or monetize. In Scenario E, the new afforestation areas will be planted with exotic forestry, in this case Pinus radiata, which results in an increase in net land revenue from timber. There are also several other ecosystem services that can either be quantified or described qualitatively. The new exotic forest area may directly or indirectly affect a number of cultural services. For example, nearby recreational opportunities like birdwatching or hiking may increase. Alternatively, esthetic values (related to scenic views) may increase or decrease as some people prefer indigenous vegetation over exotic vegetation (Brown et al. Reference Brown, Mortimer and Meurk2012). Moving from a pastoral land use to forested land may increase esthetic values. Footnote 21
The increase in exotic forestry in the Manawatū catchment in Scenario E is estimated to increase EBIT by approximately $18 million/yr (Table 3). The Tararua district is expected to experience the largest gain in EBIT from the new afforestation areas while Masterton gains the least. Overall, we estimate that the total net present value (NPV) of EBIT earned or lost from converting current land use to exotic forestry across 50 years using a discount rate (r) of 8% increases by more than $200 million (552%).
Table 3. Estimated EBIT (net land revenue) impacts from afforestation scenarios

There are some important caveats to these results. First, a large expansion in forestry would require a parallel expansion in the underlying local infrastructure, such as nearby mills, durable roads, and skilled workers. Footnote 22 Second, the likelihood of farmers converting pastoral land to exotic forestry is probably mixed. The large upfront costs and long lag time before the trees are harvested means that exotic forestry may not be considered a viable option for some farmers, particularly those more risk-averse farmers. Risk-averse farmers tend to be the older and more experienced farmers – who are becoming the majority. Footnote 23 On the other hand, current and future carbon prices may send strong incentives for the conversion of marginal lands to exotic forestry, especially given the large increases in the ETS price over the last few years. Indeed, there was a recent governmental consultation on exclusion of exotic permanent forestry from the ETS system as there was a worry that high carbon prices could encourage fast-growing permanent exotic forests to replace indigenous forests. Footnote 24
While converting current land use to indigenous trees will reduce earnings from nonforestry operations, we assume that some of the new afforestation area in Scenario I will revert to Mānuka/Kānuka and be used for Mānuka honey production (Table 3). The estimated annual honey-related profit is expected to increase by nearly $2.5 million/yr (76%), while the total NPV over 50 years (r = 8%) is estimated to increase by $33.8 million (82%).
3.3 Water quality benefits
Table 4 lists the estimated reductions in nitrogen (N) leaching from NZFARM. The first three columns show the total N leaching based on current land use and the two afforestation scenarios. The next two columns convert the change from baseline to each scenario into a percent. Note that this percent assumes that all new afforestation areas have been afforested.
Table 4. Estimated nitrogen leaching impacts from afforestation scenarios

Walsh et al. (Reference Walsh, Guignet and Booth2022) demonstrate a benefit transfer of their results, which we follow here, with a few adaptations. We have changes in nitrogen leaching from NZFARM, which we need to translate to changes in the three parameters from Walsh et al. (Reference Walsh, Guignet and Booth2022): nutrient criteria achieved, E. coli criteria achieved, and clarity. To translate changes in nutrient loading into changes in in-stream nutrient criteria, we assume a proportional relationship. Studies have shown that nutrient leaching has a large impact on local water quality. Julian et al. (Reference Julian, de Beurs, Owsley, Davies-Colley and Ausseil2017) analyze the impact of a number of landscape and land use-related factors on local water quality in New Zealand. They find that several types of local land use have a significant impact on a range of water quality indicators. The study suggests that agricultural intensification and nutrient loads are significant contributors to water quality conditions, especially nutrients. Using Spearman correlation coefficients, they found that the correlation between the density of cattle and TN and TP was 0.85 and 0.72, respectively. Furthermore, stepwise multivariate regression models found that land use was the primary and secondary predictor for all five water quality variables that they analyzed.
Following those results, we assume a conservative 50% of the change in nutrient loading is passed onto local river and stream nutrient conditions. Following Walsh et al. (Reference Walsh, Guignet and Booth2022), we use a data set of several hundred thousand water quality observations to estimate the likely parallel changes in E. Coli and clarity. Using the projected changes in water quality and the values from the study for nutrients, clarity, and E. Coli, we obtain an annual benefit of $1,857,249/yr for Scenario E and $2,031,974/yr for Scenario I. The vast majority of those values are from clarity, with $1,741,475 in annual clarity benefits for Scenario E and $1,892,155 for Scenario I.
To project the values over 50 years, we need to control for increasing population. The 2013 Census population growth figures (which are the most representative of these data) are used to extrapolate population out 50 years to calculate total benefits (Table 5). The NPV of the benefits stream is calculated using two alternate discount rates. The first discount rate, 8%, is the recommended rate by the NZ Treasury. The second discount rate, 3%, is a common rate recommended in the general valuation literature to discount social welfare benefits (US EPA 2014). The alternate discount rate is used because the 8% figure is more representative of capital expenditures and likely does not represent social discounting of WTP (US EPA 2014). (Table 5).
Table 5. NPV of total WTP for water quality benefits in Manawatū catchment over 50 years

3.4 Climate regulation benefits
Using NZFARM, we estimate changes in net GHGs (avoided GHG emissions plus carbon sequestered) with each afforestation scenario (Table 6). Scenario E has lower net GHG emissions than Scenario I. For instance, in Central Hawke’s Bay District there are approximately 960 tons CO2e emitted under the existing land use. However, when Scenario E is fully implemented and the trees are mature, that district is a carbon sink of almost 5,000 tons. Under Scenario I, the district is only a 1,000 tons carbon sink
Table 6. Change in annual net GHGs in the Manawatū catchment
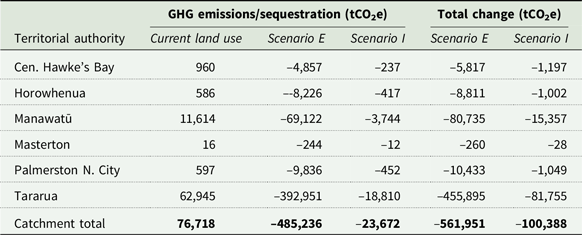
a: a negative number means carbon is being sequestered and on net there is a reduction in GHG emissions.
The GHG figures presented in Table 6 represent the steady-state levels of GHG emissions, which can then be converted to annual fluxes to estimate sequestration rates.
For our calculations, we assume that the exotic forest (Scenario E) has a harvest in year 30, while the indigenous forest (Scenario I) keeps growing over the 50-year time period. The lookup tables allow us to control for the size of the harvest, as well as carbon remaining after the harvest in stumps and the soil, which diminishes over time. We incorporate both effects in our estimates. The valuation assumes that credits generated are sold in the same year and that credits have been purchased to cover any harvest-related GHG emissions. Footnote 25 Note that an estimate based solely on the ETS lookup tables is likely an underestimate, since it only values the carbon sequestered as a result of the new land use. The reductions in emissions from the previous agricultural land use are not included in these calculations. Footnote 26
We use several different carbon prices to explore the impact of changes in GHGs. A lower bound of $17 per ton of CO2 ($17/tCO2e, in 2020 dollars) is used to represent the lower levels of the ETS price seen last decade. We also use US government’s social cost of carbon (SCC) at 3%, translated into New Zealand Dollars ($70/tCO2 to start, but which changes over time). A constant NZETS price is a strong assumption, particularly if new sectors are covered by the NZETS in the future which changes market conditions. The large recent increases in the NZETS price are within the range of the US SCC. Future international agreements, and New Zealand’s integration into them, could significantly affect the market price.
A recent report by the Parliamentary Commission for the Environment projects that 2030 carbon prices could be as high as $150 per ton CO2e, with a low estimate of $20 per ton CO2e. Footnote 27 The US EPA SCC 3% is used to account for potentially higher future carbon prices, although future work should explore the 95th percentile values of the SCC, as well as other updates. Exploring SCC values across time is somewhat complicated since the social cost of CO2 is both dollar year and emissions year dependent. We only use the 3% estimate here for comparison to the NZETS 3% estimate. There is a wide international literature recommending lower values for social welfare, particularly those related to environmental benefits (David et al. Reference David, Richard and Gary2009; Guo et al. Reference Guo, Hepburn, Tol and Anthoff2006; Pearce Reference Pearce2003). Given the PCE forecasts and the higher US EPA SCC values, our estimates are likely conservative and may therefore be underestimates of the true value of carbon for each of the afforestation scenarios.
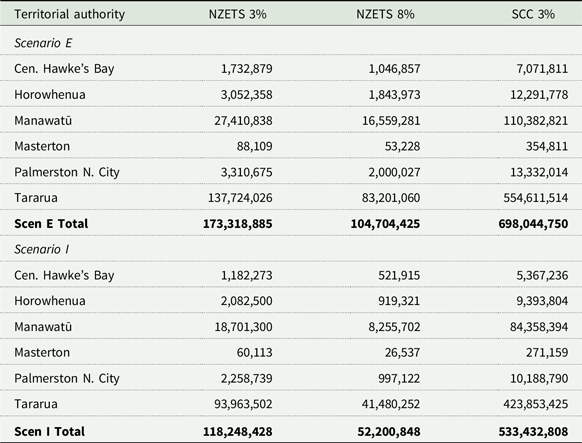
The monetized benefits of carbon sequestration for both scenarios outlined in Table 7. All estimates in the table represent the NPV across 50 years. Depending on the price assumption, benefits for Scenario E range from approximately $105 million to almost $700 million for the Manawatū catchment. Scenario I produces slightly lower carbon monetized benefits than Scenario E. For example, the NZETS 3% price is estimated to generate $118 million in carbon benefits in Scenario I as opposed to $173 million in Scenario E. Although the average tree density – and hence sequestered carbon – of exotic forests is more than indigenous forests, they are periodically harvested.
Table 7. NPV of carbon benefits for Scenarios E and I over 50 years
3.5 Biodiversity-related benefits
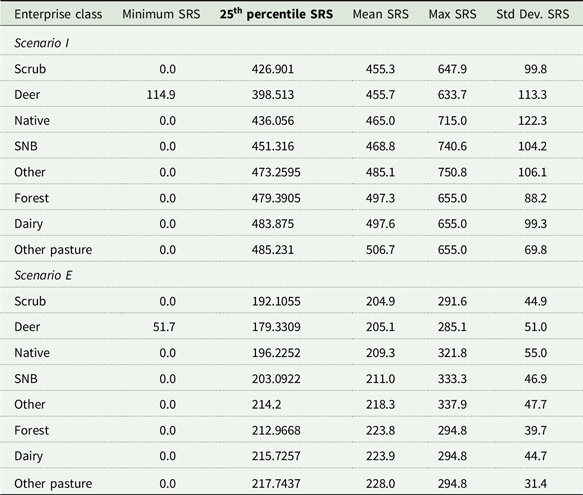
To gauge the potential biodiversity benefits from indigenous afforestation, we overlay the new afforestation areas with the scores of restored significance (SRS) ecological integrity data based on several detailed local criteria. That detailed focus helps explain the average SRS scores for the areas previously classified as native and forest, which at first glance seem counter intuitive. Average SRS for indigenous forest areas, for example, is higher than sheep & beef areas. Most of the new afforestation areas are on marginal lands that could see significant benefit from conversion to indigenous forest. These estimates also represent the maximum potential biodiversity once the area has been fully restored. These SRS calculations require two important caveats. First, although our SRS estimates are based on very spatially explicit underlying data, the actual realized biodiversity may differ from the predicted estimate. We therefore present multiple descriptive statistics to better gauge the distribution of potential benefits. In addition, the SRS estimates represent the full benefits once the plot of land is fully regenerated. According to the underlying studies the derivation of SRS is based on, regeneration is likely to take 40–50 years. Therefore, the SRS is approximating the biodiversity potential at the end of that time period.
Biodiversity for Scenario I and E will differ due to differences in forest type (Table 8). Scenario E will have much less plant diversity, which will support less diversity of other species. Another fundamental difference in exotic forestry is the periodic harvesting where land will be harvested shortly after reaching peak potential biodiversity potential. Harvesting is likely to damage biodiversity significantly. We, therefore, update the SRS estimate for exotic forest based on several studies that compare biodiversity under native and exotic forests, including Pawson et al. (Reference Pawson, Brockerhoff, Meenken and Didham2008) and Deconchat et al. (Reference Deconchat, Brockerhoff and Barbaro2009). Assuming that the exotic forests will be harvested roughly once in a 50-year period, these levels of biodiversity are only likely to be fully achieved once in this period. Therefore, the average annual biodiversity benefits will be much lower. Recent nonmarket valuation studies indicate that the general public are willing to pay to protect and restore endemic species (for instance, Yao et al. (Reference Yao, Scarpa, Harrison and Burns2019) demonstrate values associated with kiwi, giant kokopu, kakabeak, geckos, and bush falcons). However, practical difficulties, like available ecological and cost models for these species, prevent their use in policy analysis-focused benefit transfer.
Table 8. Restored significance scores for afforestation areas by existing land use by scenario
When assessing the benefits and costs of the two afforestation scenarios for the Manawatū catchment it is important to consider those that can be monetized, those that can be quantified, and those that can only be qualitatively described. The previous sections outline a number of impacts related to the afforestation scenarios that can be quantified and/or monetized impacts. While it is possible to quantify and/or monetize other impacts, the time and effort constraints for this study mean that no additional primary data or ecosystem modeling could be undertaken. In terms of benefits and costs, the benefits are often more challenging to quantify. For instance, esthetic values are difficult to quantify, and esthetic preferences can vary significantly across the population and across time. To estimate those benefits properly, a stated preference survey would be ideal (Freeman Reference Freeman2003). Similarly, more advanced ecosystem modeling would be needed to quantify the indirect impacts of changes in biodiversity.
3.6 Cultural and other values
Although we cannot directly quantify changes in cultural values as a result of afforestation activities, it is possible to compare between exotic and native outcomes. The above biodiversity discussion noted the larger improvements associated with native forest. Although biodiversity itself is important, the types of species and habitat are also paramount. Native forests in New Zealand are renowned habitats for endemic species (Miller et al. Reference Miller, Dickinson and Reid2005). Several of these endemic bird species have significant mana (roughly authority and prestige) with local Māori groups. For instance, the kererū is considered mana rangatira (noble bird) by the Tuawhenua people due to its traditional uses. Its abundance was considered by Māori to be an indicator of the mauri, or life force, of the forest (Timoti et al. Reference Timoti, O’B Lyver, Matamua, Jones and Tahi2017). Although kererū can be found in exotic forest, they do much better in those with native forests. Footnote 28 There are many other endemic species that evolved in native forests and hence do better in those habitats. A recent analysis of habitat factors for native birds found that native birds did much better in areas of continuous native forest (Barnagaud et al. Reference Barnagaud, Barbaro, Papaïx, Deconchat and Brockerhoff2014). This suggests that native forest has larger cultural values related to species than exotic forests. Native forests also produce more medicinal, craft, food, and other cultural goods than exotic forests.
While profits appear to be higher in exotic forests than native forests, it is also worth noting that there are several local, regional, and national programs aimed at increasing native forest. Grants and loans are available from the Department of Conservation, MPI, Te Uru Rākau, and other private groups. Footnote 29 Many of these programs emphasize the production of cultural services through afforestation. Tuahine (Reference Tuahine2018) describes some of this support in the context of the NZ ETS. These government and private programs illustrate the wide public support for native forests for their less-tangible benefits.
3.7. Ecosystem service summary
In the absence of additional data collection and ecosystem modeling, we use an ecosystem services framework to describe the broader range of impacts and the subsequent benefits and costs of the afforestation scenarios.
Table 9 presents a summary of ecosystem service impacts, using colors to indicate potential impacts, in order of negative to positive impact by red, orange, yellow, light green, and the most positive impacts in dark green.
Table 9. Summary of ecosystem service impacts relative to baseline
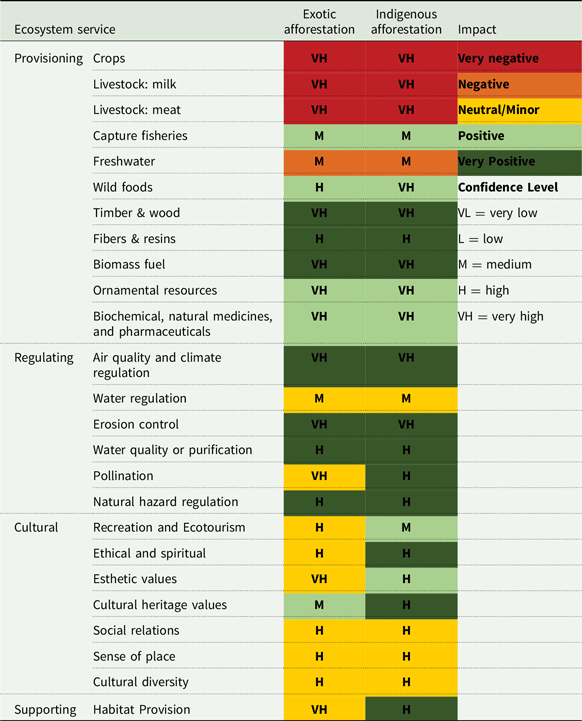
A more complete ecosystem service table that describes impacts and sorts them into those that were quantified or monetized can be found in the appendix. The narratives in the table, in particular for those ecosystem service impacts that are qualitatively described, are not comprehensive. The table does, however, draw on expected ecosystem service relationships and insights gained from other situations which are likely transferable to this context.
4. Summary and conclusion
A summary of the monetized benefits and costs for the Manawatū catchment for the two afforestation scenarios is provided in Table 10. All figures are in 2017 dollars and use discount rates of 8 and 3 percent. Footnote 30 There are a variety of issues (not presented here) involving the magnitude of the discount rate. Footnote 31
Table 10. Monetized benefits and costs across 50 years (r = 3 and 8%)
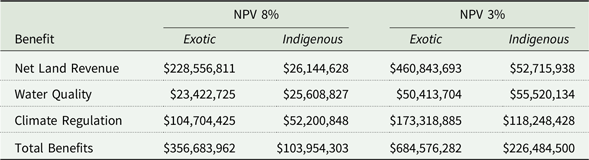
In terms of discounted benefits, Scenario E yields the largest monetized benefits, at approximately $685 million, which includes increased profit from exotic forestry, water quality benefits, and carbon-related benefits. Scenario I has lower carbon benefits, slightly higher water quality benefits, and lower net production-related revenue. Total benefits for scenario I are $226 million using a 3% discount rate. These differences in benefits between the two scenarios are important, as they each come with their own caveats. Future policy, climate change, and farmer preferences can significantly affect the benefits realized by each scenario in different ways.
The overall NPV and the benefit-cost ratio show all scenarios as having a positive benefit-cost ratio, and NPVs of several hundred million dollars. Although Scenario E has higher monetized net benefits, there are many other benefits that were not monetized. For instance, biodiversity benefits were found to be considerably higher for indigenous forest, although they were not assigned dollar values. Cultural, recreation, esthetic, and human health impacts were also not monetized or quantified. Available evidence suggests that many of these unquantified benefit categories are higher for indigenous forests. Cultural services, for instance, are much higher in indigenous forests than exotic forests. There is also more government and private support, in terms of grants, loans, and training, for indigenous forests.
The preferable afforestation scenario therefore depends on the preferences and constraints of the policy makers. The New Zealand government is currently supporting a blended approach to promote both types of forests. Exotic forestry is an important source of jobs and economic productivity while indigenous forest is associated with less economic benefit but higher cultural, recreation, and other benefits. Overall, we find that both exotic and indigenous forest have the potential to produce significant benefits. With flexible policy that provides balanced incentives to producers, both types of forest can achieve multiple regional and national goals.
Data availability
The economic modeling and land use data that support the findings of this study are available from Manaaki Whenua, Landcare Research. Restrictions apply to the availability of these data, which were used under license for this study.
Acknowledgment
The authors would like to thank participants at the 2022 NAREA Annual Conference and Manaaki Whenua LINK Seminar Series.
Funding statement
This work was partially funded by the New Zealand Ministry for Primary Industries, under Landcare Contract Report LC2788.
Competing interests
The authors declare none.
Appendix
Detailed afforestation ecosystem service description


 Open access