
The Chesapeake Bay’s three largest rivers — the Susquehanna, Potomac and James — are showing long-term reductions in nutrient pollution, according to data recently released by the U.S. Geological Survey.
The trends are particularly notable in the Susquehanna, where USGS monitoring has shown steady improvements in recent years — despite concerns about the impact of Conowingo Dam and complaints that Pennsylvania, which holds most of the river’s watershed, is not doing enough to help the Bay. USGS scientists say they are working to better understand the reasons for that trend.

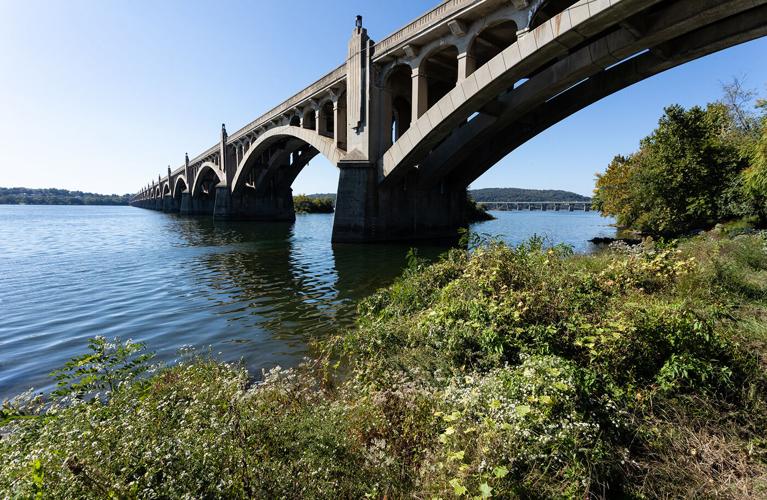
Findings reported by the the U.S. Geological Survey in 2021, based on water quality monitoring, demonstrate long-term reductions in nutrient pollution in the Susquehanna River, shown here near Wrightsville, PA. Long-term nutrient loads in the Potomac and James rivers are trending downward, too.
Whatever the explanation, they say the results show significant long-term improvements since 1985 in the three rivers that deliver the majority of water-fouling nutrients — nitrogen and phosphorus — to the Chesapeake.
The monitoring also shows downward short-term trends, covering the last 10 years, for nitrogen in all three rivers. The Susquehanna and James show improving short-term phosphorus trends, while the Potomac showed no short-term improvement for that nutrient.
“It is a very positive story if you just look at the trend results we are seeing for the Susquehanna, Potomac and James,” said Doug Moyer, a USGS hydrologist. “Those have big deliveries to the Bay, and those are the main tributaries.”
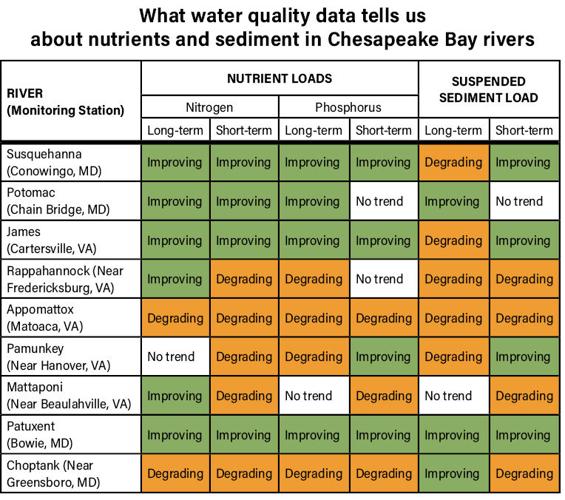
But the story changes dramatically for most smaller tributaries that are also part of the USGS “river input monitoring” system. Nutrient trends in the Rappahannock, Appomattox, Pamunkey and Mattaponi rivers in Virginia, and the Choptank River in Maryland are generally degrading.
Among smaller rivers that are part of the monitoring system, widespread improvements have only been seen in the Patuxent in Maryland — where nutrient sources are dominated by wastewater treatment plants that have been upgraded.
Moyer said the driving forces for the degrading trends in most of those rivers were uncertain. But, he added, “These are our best data sets. So the patterns have a solid foundation.”
The river monitoring network collects water samples near the fall line of nine major rivers, which provide more than 95% of the freshwater flow to the Chesapeake, to estimate the amount of nutrients and sediment reaching the Bay’s tidal waters. (The fall line generally marks the upper edge of the Bay’s tidal waters. Measuring inputs to the Bay below the fall line is difficult because of the back-and-forth movement of tidal waters.) Altogether, the nine stations in the river input monitoring system reflect what is draining off the land from about three-quarters of the watershed.
All of the sites have collected nutrient and sediment data since at least 1985, but the data alone don’t explain the causes of those trends. USGS scientists are hoping to gain some insights next year when they review information from scores of smaller sample sites farther upstream, most of which have been gathering data for shorter periods of time.
Meanwhile, scientists have been exploring what is happening in the Susquehanna, which delivers half of the freshwater reaching the Bay and is the largest single source of nutrients. The turnaround on the river has been significant: As recently as 2014, for instance, the Susquehanna had mostly degrading trends or no trends. Only the long-term nitrogen trend was slowly improving.
“The Susquehanna, of all the basins, is very complex,” Moyer said, noting that it is by far the largest watershed, with the most farmland and the most forest. It also has several major reservoirs that affect nutrient and sediment movement. “That is why it is very difficult to assign causality to that trend,” Moyer said.
But one likely contributing factor is the filling of the reservoir behind the Conowingo Dam. Scientists say the reservoir is in a state of “dynamic equilibrium,” meaning it no longer serves as an effective long-term trap for sediment and associated nutrients — as was the case for much of the last century — allowing more of the pollutants to spill downstream.
Joel Blomquist, a USGS hydrologist who has been examining the Susquehanna data, said it is possible that the huge river flow associated with Tropical Storm Lee in 2011 washed away enough built-up sediment from the Conowingo reservoir to allow the dam to begin trapping more of the sediment and nutrients flowing downstream.
“This could be a natural cycle of what dynamic equilibrium looks like, with periods of trapping followed by periods of release,” Blomquist said, “[but] there could be other drivers in there, and we just don’t have a technique to tease that out quite yet.”
Any effect from Tropical Storm Lee, he added, would only affect the river’s short-term trend. “The long-term still holds true as an improvement.”

Long-term trends are from 1985–2020. Short-term trends are from 2011–2020. (Bay Journal/Source: USGS, July 2021)
(0) comments
Welcome to the discussion.
Log In
We aim to provide a forum for fair and open dialogue.
Please use language that is accurate and respectful.
Comments may not include:
* Insults, verbal attacks or degrading statements
* Explicit or vulgar language
* Information that violates a person's right to privacy
* Advertising or solicitations
* Misrepresentation of your identity or affiliation
* Incorrect, fraudulent or misleading content
* Spam or comments that do not pertain to the posted article
We reserve the right to edit or decline comments that do follow these guidelines.