
Homeownership lies at the heart of the American Dream, representing success, opportunity, and wealth. However, for many of its citizens, America deferred that dream. For much of the 20th century, the devaluing of Black lives led to segregation and racist federal housing policy through redlining that shut out chances for Black people to purchase homes and build wealth, making it more difficult to start and invest in businesses and afford college tuition. Still, homeownership remains a beacon of hope for all people to gain access to the middle class. Though homeownership rates vary considerably between whites and people of color, it’s typically the largest asset among all people who hold it.
If we can detect how much racism depletes wealth from Black homeowners, we can begin to address bigotry principally by giving Black homeowners and policymakers a target price for redress. Laws have changed, but the value of assets—buildings, schools, leadership, and land itself—are inextricably linked to the perceptions of black people. And those negative perceptions persist.
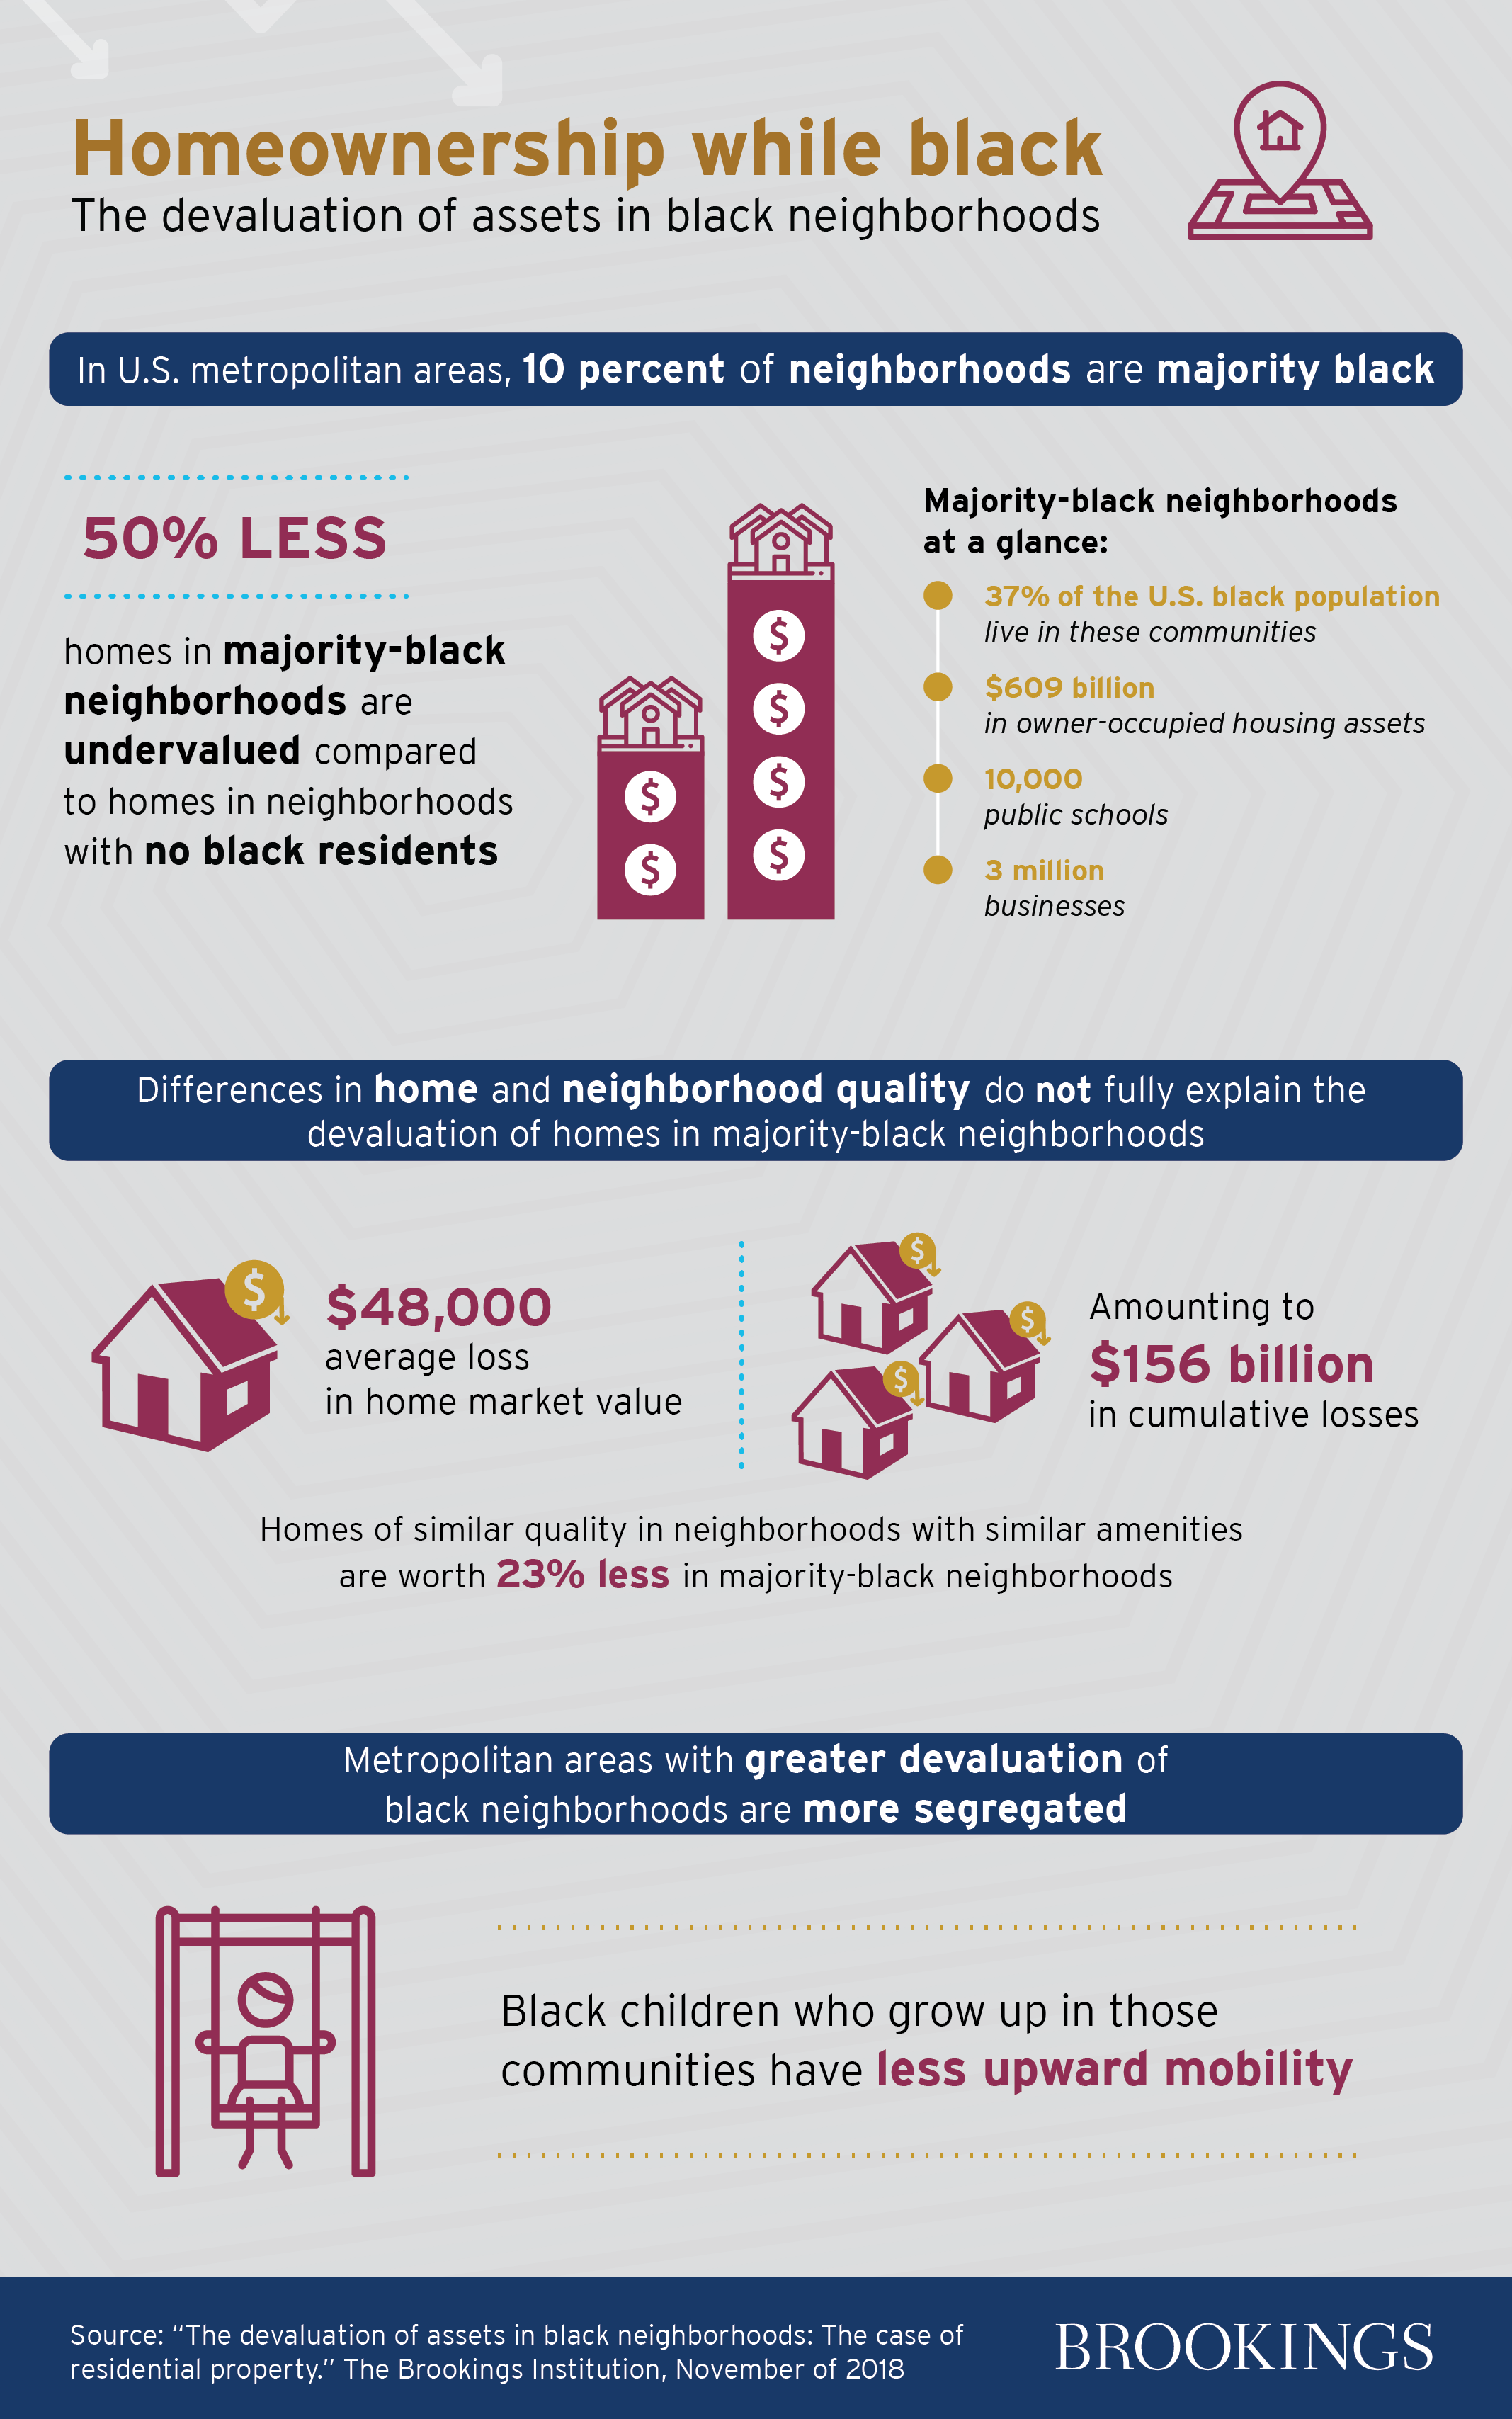
Through the prism of the real estate market and homeownership in Black neighborhoods, this report attempts to address the question: What is the cost of racial bias? This report seeks to understand how much money majority-Black communities are losing in the housing market stemming from racial bias, finding that owner-occupied homes in Black neighborhoods are undervalued by $48,000 per home on average, amounting to $156 billion in cumulative losses.
In analyzing the devaluation of Black homeownership, this report finds:

Majority-Black neighborhoods hold $609 billion in owner-occupied housing assets and are home to approximately 10,000 public schools and over 3 million businesses. We find that in the average U.S. metropolitan area, homes in neighborhoods where the share of the population is 50 percent Black are valued at roughly half the price as homes in neighborhoods with no Black residents.

According to our analysis, differences in home and neighborhood quality do not fully explain the devaluation of homes in Black neighborhoods. Homes of similar quality in neighborhoods with similar amenities are worth 23 percent less ($48,000 per home on average, amounting to $156 billion in cumulative losses) in majority Black neighborhoods, compared to those with very few or no Black residents.

In U.S. metropolitan areas, 10 percent of neighborhoods are majority Black, and they are home to 41 percent of the Black population living in metropolitan areas and 37 percent of the U.S. Black population. Though most residents are Black (14.4 million non-Hispanic Blacks) by definition, approximately 5 million non-Black Americans live in majority Black neighborhoods.

Metropolitan areas with greater devaluation of Black neighborhoods are more segregated and produce less upward mobility for the Black children who grow up in those communities. This analysis finds a positive and statistically significant correlation between the devaluation of homes in Black neighborhoods and upward mobility of Black children in metropolitan areas with majority Black neighborhoods.
What does devaluation measure?
We focus on owner-occupied homes for two reasons. First, home appreciation results in higher home values, and this brings wealth to owners. There is a large and well-known wealth gap between Blacks and other racial groups in the United States, much of which can be attributed to differences in homeownership rates and the value of housing. Second, the devaluation of rental properties is advantageous to renters, in so far as it results in a lower rental payment for similar quality housing. The devaluation of owner-occupied housing makes it easier to acquire the home, but once purchased, it is unambiguously disadvantageous to the owner and occupier, who would otherwise benefit from being able to refinance, borrow, or sell at a higher valuation.
Absolute difference in home value is measured as the difference in median home values between neighborhoods with at least 50% Black population and neighborhoods that are less than 1% Black, using self-reported home values from the American Community Survey. The devaluation analysis also analyzes median listing prices of homes overall and per square foot, using data from Zillow.
Structural characteristics are physical qualities of a home which predict its value, such as year built, square footage, number of rooms/bedrooms, and others (see text for full accounting of variables used). With the exception of square footage, which is incorporated into price per square foot measures used from Zillow, these data are aggregated to the neighborhood level in the analysis.
Neighborhood amenities are qualities which reflect the economic, demographic, and physical landscape of the neighborhood. Indicators which may affect home valuation include the quality of public education, walkability, access to jobs as measured by mean commute times, access to retail, and others (see text for full accounting of variables used).
Devaluation is defined as the percent discount in median home values between neighborhoods with 50% Black population and neighborhoods with no Black residents, after accounting for structural characteristics of homes and neighborhood amenities. In our preferred estimate, it is calculated by observing the relationship between median neighborhood home prices per square foot (from Zillow) and Black population shares across the full range of neighborhoods within individual metropolitan areas that have at least one majority Black neighborhood and at least one neighborhood with less than 1% Black population shares. In most, though not all, metropolitan areas with at least one neighborhood of each type, the percent difference is negative. Structural characteristics of homes and neighborhood amenities do not fully explain the absolute difference in home value.
The interactive map and dashboard below show how devaluation of Black homes plays out in different communities across the United States. The sample of metropolitan areas is limited to those with at least one majority Black neighborhood and one non-Black neighborhood, defined by having less than a 1% Black population share.
…
We restrict this analysis to the 113 metropolitan areas with at least one majority Black neighborhood. We also give extra weight in the analysis to metro areas with larger Black populations to reduce the influence of measurement error; as such, the estimates should be thought of as characterizing the experience of the average Black person living in different types of metropolitan areas.
Select a metropolitan area using the dropdown menu below to view its dashboard of indicators. The summary metrics provide top-level information about the metropolitan area while the neighborhood characteristics are broken out by the share of the neighborhood population that is Black.
Metropolitan area dashboard
…
Interactive by Alec Friedhoff
Related Content


Authors


