The State of the Digital Divide in the United States
Introduction
The COVID-19 pandemic shed a bright light on an issue that has been around for decades: the digital divide. As parents, children, and workers scrambled to learn, socialize, and work from home, adequate internet connectivity became critical. This analysis takes a detailed look at the digital divide as it was in 2020 (latest year available), who it affected, and its socioeconomic implications by using an innovative metric called the digital divide index. It should also increase awareness on this issue as communities and residents prepare to take advantage of a once-in-a-lifetime investment in both broadband infrastructure and digital equity, components of the Infrastructure Investment and Jobs Act.
Data for this analysis came primarily from the U.S. Census Bureau 5-year American Community Survey. Additional sources include but are not limited to the Bureau of Economic Analysis, Lightcast (formerly known as Economic Modeling Specialists, Inc. or EMSI) and Venture Forward by GoDaddy. The unit of analysis was U.S. counties for which DDI scores were calculated 1 .
Digital Divide Index
The digital divide index (DDI) consists of three scores ranging from 0 (lowest divide) to 100 (highest divide) and includes ten variables grouped in two categories: infrastructure/adoption and socioeconomic. For purposes of analysis, the overall DDI score was utilized. Counties were divided into three roughly equal groups based on the DDI score: low (1,031 counties), moderate (1,031 counties), and high (1,063 counties).
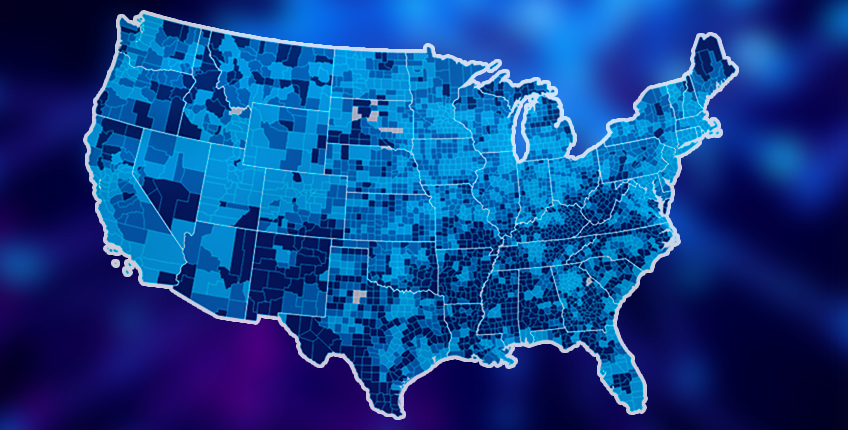
These groups were then utilized to analyze a host of other variables to better understand this issue. Figure 1 shows a map of U.S. counties by DDI groups. Of the 1,031 counties with a low digital divide, 747 or 72% were considered urban (population living in urban areas 2 was more than 50%). On the other hand, of the 1,063 counties with a high digital divide, only 187 or 17.5% were urban.
Figure 1 – U.S. Counties by DDI Group
Figure 2 shows the average DDI scores by group. The low group had an average score of 17.33, the moderate group an average score of 26.35, and the high digital divide group an average score of 36.58.
Figure 2 – Average DDI Scores by Group
Next, we look at a host of variables by the DDI group to better understand who it affected and its socioeconomic implications.
Demographics
Figure 3 shows selected demographic characteristics in counties with a low and high digital divide. A higher share of the population in counties with a high digital divide are rural, veterans, living in poverty, and disabled. On the other hand, a higher share of the population in counties with a low digital divide are minorities. While this was somewhat surprising, keep in mind that many counties with a low digital divide are urban, which in turn have a higher share of minorities. Please note that minorities include all but White, non-Hispanic. The share of children is roughly the same between low and high digital divide counties at roughly one-fifth.
Figure 3 – Percent of Population by Selected Demographic Characteristics in Low and High DDI Counties
Workforce
As the economy continues to digitize, it is important to understand who is being left behind from a workforce perspective. Figure 4 shows the share of population by selected workforce-related variables in low and high digital divide counties. As shown, the share of children enrolled in K-12th grade without a computer or internet subscription is higher in counties with a high digital divide. In fact, one-quarter of children enrolled in Pre-K through 4th grade in high digital divide counties did not have a computer or internet subscription.
Regarding educational attainment, the share of those 25 years or older in high digital divide counties with a bachelor’s degree or higher is 20 percentage points lower compared to the share in low digital divide counties (16.6 versus 36.7). Likewise, the labor force participation rate among the working age population (ages 16 to 64) as well as the prime working age population (ages 25 to 54) is lower in counties with a high digital divide compared to counties with a low digital divide.
Figure 4 – Percent of Population by Selected Workforce Variables in Low and High Digital Divide Counties
Households
Additional household characteristics need to be understood within the digital divide context. Figure 5 shows the share of households by selected characteristics in low and high digital divide counties. The share of lower earning households was higher in high digital divide counties as was the share of households with a person 60 years or older. The share of households with a person 65 or older living alone was also higher compared to low digital divide counties. Regarding the share of households with limited English, the share was slightly higher in counties with a low digital divide compared to a high digital divide.
Figure 5 – Percent of Population by Selected Workforce Variables in Low and High Digital Divide Counties
Digital Distress and Internet Income Ratio
A related metric our Center developed is called “digital distress”. This metric utilizes fewer variables than the DDI but also offers insights for community leaders and residents regarding digital inequities. Figure 6 shows the four variables used to calculate digital distress by low and high digital distress in counties.
Figure 6 – Percent of Households by Digital Distress Metrics in Low and High Digital Divide Counties
One of the variables recently added to the DDI is the “Internet Income Ratio” or IIR. The IIR gauges digital inequality by dividing the share of homes making less than $35,000 without internet access by the share of homes making $75,000 or more without internet access. A higher IIR denotes a higher inequality. Figure 7 shows the share of homes without internet access as well as the IIR in low and high digital divide counties.
In other words, the share of lower income households without internet access is 7.1 times higher compared to the share of wealthier households without internet access in low digital divide counties. This number is higher compared to the 4.4 in counties with a high digital divide. This may seem counterintuitive but nonetheless makes the argument that digital inequity continues to be an issue even in counties with a low digital divide.
Figure 7 – Internet Income Ratio (IIR) in Low and High Digital Divide Counties
Homework and Senior Gap
The homework gap has been discussed widely during the pandemic. It refers to the percentage of children that do not have internet access and struggle to complete their homework assignments. Another gap—that is not discussed as much—is the senior gap. This refers to the population aged 65 or older with no internet or computer access. This group can enhance their quality of life significantly if they can participate in online activities. Figure 8 shows the percentage of children and the population ages 65 or older with no access to computers as well as having access to computers but no internet.
As shown, counties with a high digital divide—as measured by the DDI—have a higher children (homework) and senior gap. However, it is important to note that while lack of internet is an issue among seniors, lack of computers is more of an issue. Consider that one-quarter of the population age 65 or older in high digital divide counties did not have a computer compared to 10.5% having a computer, but no internet access.
Figure 8 – Percent of Children and Seniors by Selected Characteristics in Low and High Digital Divide Counties
Digital Economy
This last group of variables shed light on the digital divide and digital economy implications. Figure 9 shows the share of jobs by selected characteristics in low and high digital divide counties. Note that the number of jobs in counties with a low digital divide grew by 11.7% between 2010 and 2020 compared to a 0.5% decrease in counties with a high digital divide. As expected, the share of digital economy jobs 3 in counties with a low digital divide was higher compared to the share in counties with a high digital divide, as was the share of remote work friendly occupations and workers ages 16 and older working from home.
Figure 9 – Share of Jobs by Selected Characteristics in Low and High Digital Divide Counties
Regarding the roughly 80% of occupations, whose digital skill levels were measured, Figure 10 shows that counties with a high digital divide had a lower share of occupations requiring high digital skills (21%) compared to counties with a low digital divide (30.8%). Likewise, the share of jobs requiring low digital skills was larger in counties with a high digital divide compared to counties with a low digital divide.
Figure 10 – Share of Occupations by Digital Skill Level in Low and High Digital Divide Counties
To wrap-up this analysis, we look at two innovative metrics developed by the Venture Forward project by GoDaddy. This project has calculated a microbusiness density metric (the higher the number, the better) that is highly correlated with economic benefits as well as the microbusiness activity index, that considers three components. Infrastructure refers to how ready the county is in terms of physical and intellectual infrastructure. The participation component looks at the number of GoDaddy online microbusinesses run by residents in the community. And the third engagement component looks at how active the websites are in the community. These new metrics are very insightful because there were 2.8 million more online microbusinesses in 2020 compared to 2019.
As shown in Figure 11, the average microbusiness density in low digital divide counties was double the density in high digital divide counties (6.4 versus 3.2). In addition, microbusiness activity index was 15 points higher in low digital divide counties (106.3 versus 91.6). What is interesting, however, is that the difference in the infrastructure and participation components is not as high. This implies that high digital divide counties have some elements in place to take advantage of the digital economy. The issue seems to be more about sophisticated online presence (engagement).
Figure 11 – Microbusiness Density and Activity Index in Low & High Digital Divide Counties
Conclusions and Discussion
The objective of this analysis is to provide a deeper understanding of who the digital divide affects and what socioeconomic implications there are to help communities as they plan and implement their digital equity and broadband infrastructure plans. Please note that we deliberately included metrics that shed light on specific populations targeted by the digital equity act. A couple of disclaimers first, before we jump into conclusions.
First, a tradeoff of grouping counties and analyzing averages is that critical and underlying dynamics are overlooked. Even if your county is included in the low digital divide category, this does not mean that the issue has been addressed. On the other hand, if your county has a high digital divide, this does not mean the situation is dire. There are certainly assets and resources that can be mobilized. Second, this data is two years old. The urgency and nature of the pandemic caused things to go in overdrive creating a highly dynamic landscape. We encourage our readers to use this as a baseline and pursue their own strategies to gather more timely and granular data, including assets and resources.
As shown in this analysis, the digital divide affects groups and areas in different ways. While a greater share of residents living in high digital divide counties are rural, this issue affects urban areas as well. An example of this is the fact that the share of minorities living in high digital divide counties was lower than those living in low digital divide areas. In other words, the share of White non-Hispanics was higher in high digital divide counties. This finding is surprising but makes the point that this issue is affecting residents across all races/ethnicities.
Poorer, disabled, older, less educated populations, and lower labor force participation rates are seen in higher digital divide counties. It is not clear from the analysis if this is a result of the digital divide or simply that these characteristics were already in place and the digital divide is just one more wrinkle to iron out. Also note that lack of devices, and not necessarily internet access, is a larger issue among the population ages 65 or older (also known as the senior gap).
The digital divide is holding back counties from participating fully in the digital economy. Again, it is not clear if this would have been the case regardless of the digital divide, but nonetheless it is placing communities at a disadvantage. As shown, counties with a high digital divide lost jobs between 2010 and 2020 while counties with a low digital divide saw an 11 percent increase. Likewise, the share of occupations requiring high digital skills was larger in counties with a low digital divide. Lastly, microbusiness density and activity were also lower in counties with a high digital divide. However, regarding microbusiness activity, the issue seems to be more about sophisticated online presence rather than infrastructure and number of businesses online.
Granted, these findings may be affected more by external, well-known urban and rural trends given that many counties with a low digital divide are urban. However, should this continue to be the case? What would happen if rural areas and other disadvantaged groups were at digital parity with their urban and more advantaged counterparts? Could they benefit from the digital economy as well? Luckily, significant investments will be taking place in the next several years to begin tackling these digital inequities with real-life consequences.
Footnotes
- Due to data availability, the DDI was calculated for 3,125 counties of the 3,143 in total (18 were excluded).
- Since the official 2020 urban/rural definitions will be released until December of 2022, we used one of the metrics being considered. This metric considers any Census block urban if it has at least 425 housing units per square mile, the equivalent to 1,105 people. The prior urban definition used 500 people per square mile. Please note this estimate is preliminary as the official definitions have not been released.
- Includes 44 industries with 6-digit NAICS codes considered to be “fully” part of the digital economy. These are mostly semiconductors, service providers, batteries as well as software developers and data processing to name a few. Does not include warehousing or retail associated with e-commerce.

Roberto Gallardo is the Vice President for Engagement, Director of the Purdue Center for Regional Development and an Associate Professor in the Agricultural Economics Department.... read more