
Introduction and Background
Fatalities and serious injuries resulting from traffic crashes are persistently high in New York City. Deadly crashes surged in 2020 and remain at elevated levels relative to pre-pandemic years. This trend risks reversing the hard-won safety gains under the City’s Vision Zero initiative. In 2022, 253 people were killed in motor vehicle crashes, after 273 in 2021, a 20% increase over 2019 levels. This mirrors a troubling nationwide trend of increasing traffic fatalities, with deaths among pedestrians and cyclists reaching new highs in recent years.
Amidst this background of rising traffic crashes and fatalities, the costs of claims brought against the City of New York for injuries related to motor vehicle crashes have also risen. The City fleet consists of nearly 30,000 vehicles and 85,000 operators, the largest in the country. While most traffic fatalities and serious injuries in New York City are by privately owned vehicles, claims stemming from over 4,000 crashes involving the municipal fleet have cost the City more than $600 million over the past decade.
This report analyzes motor vehicle crash-related personal injury claims against the City, filed and settled between FY 2012 and FY 2021,[1] with the goal of identifying interventions to reduce financial liability to the City and reducing preventable harms to New Yorkers. Major findings include:
- Crash claims account for almost one out of every four personal injury claims settled by the City.
- The City settled 4,656 claims between FY 2012 and FY 2021 for crashes occurring within that same period, paying out a total of $653,848,901. Claims for FY 2021 alone totaled $130.1 million.
- The average crash settlement has increased dramatically during the period covered by this report, jumping from $15,187 in FY 2012 to $242,365 in FY 2021.
- Between FY 2012 and FY 2021, 169 claims were settled for $1 million or more. These claims cost a total of $323 million to settle, meaning just 4% of crash claims account for almost 50% of the total amount paid in settlements
- City agencies responsible for large numbers of crash claims are the agencies with the largest fleets. As of FY 2021, NYPD and DSNY vehicles made up 32% and 20% of the municipal fleet and were involved in 35% and 21% of crashes resulting in claims, respectively. FDNY vehicles made up just 8% of the overall fleet but were involved in 20% of crashes resulting in claims. DOT, DEP, and Parks vehicles were involved in proportionally fewer crash claims relative to their fleet sizes.
- NYPD is responsible for the highest number of crash claims and the largest share of settlements. Between FY 2012 and FY 2021, the City settled $246.8 million in NYPD crash claims representing 37.7% of the total spent by the City on crash claims overall.
- NYPD and DSNY are responsible for two-thirds (67%) of claims settled for $1 million or more. The City settled 66 NYPD claims for at least $1 million, totaling $131 million, while DSNY accounted for 47 claims settled over $1 million, totaling $102.2 million.
- Crash claims are concentrated in community districts with higher poverty rates where residents are predominantly people of color. East Harlem in Manhattan, East New York, Bedford-Stuyvesant, and Prospect Lefferts Gardens in Brooklyn, the South Bronx, and Southeast Queens saw the highest number of crash claims in New York City.
- For claims resulting in settlements over $1 million where data on vehicle type is available, crashes involving City-owned trucks and vans resulted in the most expensive settlements. The average settlement for truck and van-involved crashes was $2.1 million and $4.3 million respectively, compared to $1.6 million for all other vehicle types. Trucks and vans were responsible for about 46% of crash claims over $1 million.
- For the 55 claims settled for over $1 million involving pedestrian, cyclist, or motorcyclist claimants, 72% resulted from crashes involving NYPD or DSNY vehicles.
The City fleet, managed by the Department of Citywide Administrative Services (DCAS), can and should be a model for safety in terms of vehicle design and driver behavior. DCAS has taken steps in recent years to improve fleet safety, through vehicle technologies and design features proven to reduce the occurrence and severity of crashes. The data from this report is intended to build on that work, and to make the case for new and strengthened interventions to reduce claim costs to the City and to enhance the safety of New Yorkers.
Data and Analysis
The number of crash claims settled by the City declined from FY 2012 through FY 2015, remained steady between FY 2015 and FY 2020, and dipped slightly to a ten-year low in FY 2021. However, total payouts for claims have nearly doubled since FY 2015. The total payout for claims filed for incidents occurring during or after FY 2012 rose from a low of $67.4 million in FY 2015 to $130.1 million in FY 2021. Average settlements have increased even more dramatically, from $15,187 in FY 2012 to $102,301 in FY 2016 to $242,365 in FY 2021 – a 1,496% increase. These increases are far greater than those for personal injury claims against the City overall, for which average payouts rose by 69% between FY 2012 and FY 2021. Median settlements for crash claims also increased during this period, but at a lower rate. In FY 2012, the median payout was $9,000 compared to $20,000 in FY 2016 and $50,000 in FY 2021.
Figure 1
Source: Office of the New York City Comptroller
Figure 2
Source: Office of the New York City Comptroller
Figure 3
Source: Office of the New York City Comptroller
The six City agencies with the largest fleets comprise 91% of total citywide claims. As of FY 2021, those agencies are NYPD (9,369 vehicles, or 32% of the City fleet), DSNY (5,946, 20%), DOT (3,444, 12%), Parks (2,834, 9%), FDNY (2,249, 8%), and DEP (2,117, 7%). Of those top six, the Police Department (NYPD) leads in the total number of claims as well as payout amounts. Since FY 2012, NYPD crashes resulted in 1,645 claims and cost a total of $246.8 million in settlements – close to 40% of the overall number. The Department of Sanitation (DSNY) followed with 981 claims which cost the City $180.3 million in settlements between FY 2012 and FY 2021. DSNY’s average settlement cost stands at $183,796, the second highest of any city agency. The City paid out $24.4 million for Department of Environmental Protection (DEP) settlements between FY 2012 and FY 2021. While this payout amount is lower than that for agencies such as NYPD or DSNY, DEP claims saw the highest average settlement costs, at $202,088. DSNY and DEP’s larger average claim size is likely the result of their larger vehicles, as discussed below.
Figure 4
Source: Office of the New York City Comptroller
Figure 5
Source: Office of the New York City Comptroller
Average payouts for every agency have increased dramatically across the board between FY 2012 and FY 2021. For crash claims filed and settled within this ten-year period, agencies are paying out settlements that are many times higher in recent years than they were in FY 2012 or 2013. DSNY’s average settlements have consistently been higher than the city average while FDNY and DOT’s have entirely or mostly been below it. DEP’s average settlement amounts have fluctuated between FY 2012 and FY 2021 and are currently the highest of any city agency. Multiple agencies saw their average settlement amounts reach new highs during the pandemic years, with NYPD, FDNY, DOT, and DEP seeing their highest average settlements in either FY 2020 or FY 2021. A table of average settlement amounts by agency over time is available in the appendix of this report.
While crashes resulting in claims against the City have occurred all over New York City, they are concentrated in a subset of neighborhoods: East Harlem in Manhattan, East New York, Bedford-Stuyvesant, and Prospect Lefferts Gardens in Brooklyn, the South Bronx, and Southeast Queens (figure 6). This pattern differs slightly from the overall distribution of crashes causing fatalities or injuries, which are spread throughout much of Brooklyn and Queens (figure 7). There are major equity implications to the distribution of crash claim locations, just as there are for crashes overall. The community districts seeing the highest number of crashes caused by city vehicles over the past ten years have poverty and unemployment rates that are higher than the city and borough average. The identified community districts are also predominantly communities of color, where the majority of residents identify as Black or Hispanic.
Figure 6: Count of City Vehicle Crashes by Community District
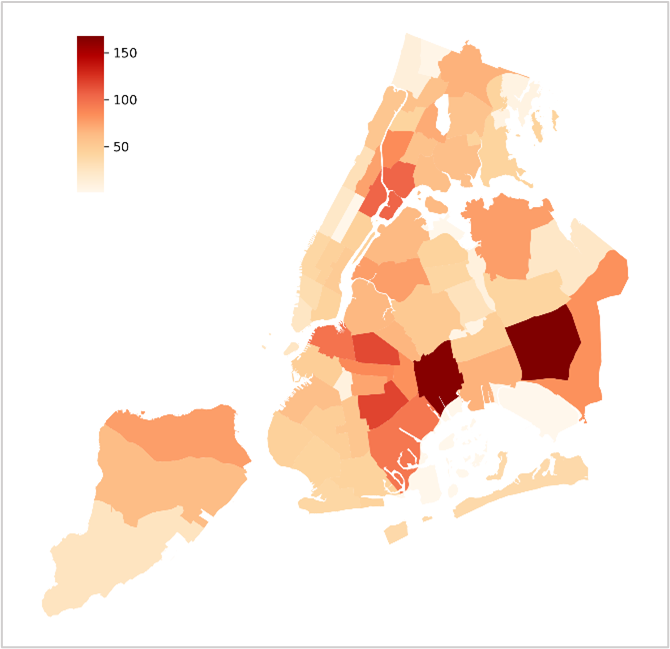
Source: Office of the New York City Comptroller
Figure 7: Count of All Crashes by Community District
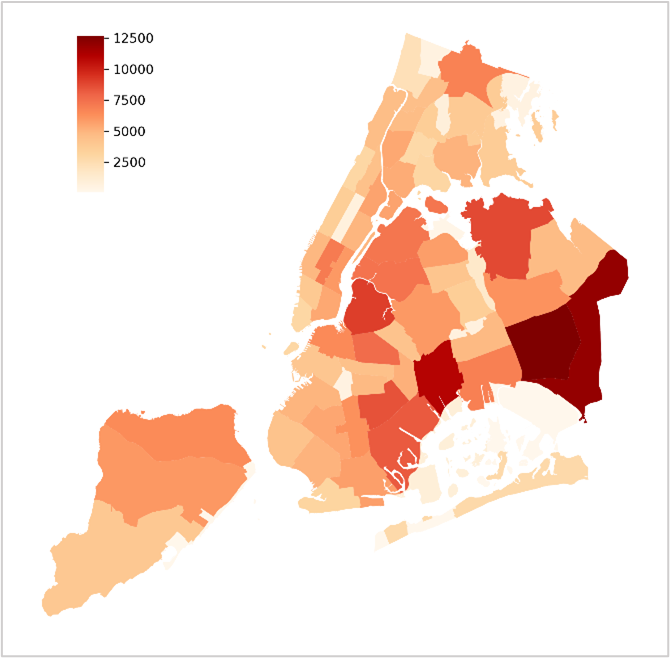
Source: NYC Crash Mapper
Claims Over $1 Million
Of the 4,656 crashes resulting in claims against the city between FY 2012 and FY 2021, 169 resulted in settlements of at least $1 million. While claims over $1 million only make up 4% of total claims, they account for 50% ($322,877,999) of total settlement costs for the City. These claims often arose as the result of crashes that caused deaths or life-altering injuries to the claimant. Of these 169 claims, approximately 39% (66) were brought against NYPD and 28% (47) against DSNY. Both NYPD and DSNY are responsible for a larger share of claims costing at least $1 million to settle than they were for claims overall. Of the agencies associated with the largest numbers of claims, only FDNY and DOT were responsible for a lower share of claims over $1 million than claims overall.
Figure 8
Source: Office of the New York City Comptroller
Figure 9
Source: Office of the New York City Comptroller
Two-thirds of claims settled for over $1 million were for crashes involving injury to an automobile driver or passenger. 55 claims, or 32%, were for crashes where the claimant was a pedestrian, cyclist, or motorcyclist. 40 out of these 55 claims resulted from crashes involving NYPD or DSNY vehicles.
For claims resulting in settlements of $1 million or more, payouts varied based on the claimant’s mode of transport. While crashes involving cyclists or motorcyclists made up just 3% and 4% of claims over $1 million, respectively, the average payouts for these claims were higher than for other modes. Cyclist claimants received an average settlement of $2.9 million while motorcyclists received $3.25 million – the highest of any mode. Crash claims involving transit passengers represented just 1% of claims over $1 million and received the lowest average payout at $1.62 million, just under the average for motorists.
Figure 10
Source: Office of the New York City Comptroller
Figure 11
Source: Office of the New York City Comptroller
Fleet Size and Characteristics
New York City maintains the country’s largest municipal fleet, at nearly 30,000 vehicles, with 23,664 on-road vehicles. The fleet grew dramatically after FY 2015, jumping to a high of 31,002 vehicles in FY 2018 before declining 5% to 29,457 as of FY 2022. Within the City fleet, larger vehicles were involved in more frequent and expensive claims than smaller vehicle types. For the 116 claims over $1 million where data on the type of vehicle involved in the crash is available, truck crashes led to payouts costing a total $97.1 million over ten years and resulted in nearly 40% of settlements – the largest share of all vehicle types. Truck crashes also had an average settlement of $2.1 million, the second highest of any vehicle type. While trucks were responsible for the largest share of claims over $1 million, crashes involving city-owned vans resulted in the highest average payout. Eight van-related crashes cost the City $34.9 million over ten years, for an average of $4.3 million each. Crashes involving sedans resulted in 31% settlements over $1 million, making up the largest share after trucks. The average settlement for sedan and SUV crashes over $1 million were $1.6 million and $1.57 million, respectively. Trucks accounted for 29% of the City Fleet in 2021, but nearly 40% of claims over $1 million. Overall, larger passenger vehicles including pick-ups, vans, and SUVs collectively account for 22% of settlement costs over $1 million, with most of these crashes occurring after FY 2016.
Despite the established relationship between vehicle size and crash severity, the number and share of large vehicles in the municipal fleet is growing. The percentage of sedans in the City fleet dropped from 35% in FY 2015 to 28% in FY 2022. During the same period, the share of vans and trucks remained largely consistent with vans making up 13% of the fleet since FT 2015 and trucks increasing slightly from 22% in FY 2015 to 25% today. The share of SUVs in the City Fleet has grown more than any other vehicle type, gradually increasing from 10% in FY 2015 to 18% today. This increase is attributable primarily to a shift away from sedans towards SUVs in the market for police vehicles. As a result, most new NYPD vehicles are hybrid or electric SUVs and crossover vehicles. As Figure 12 demonstrates, the increase in the number of law enforcement SUVs has outpaced the citywide effort to reduce the number of SUVs in other agencies’ fleets.
Figure 12
Source: Department of Citywide Administrative Services
Recommendations
Reducing the number of crashes involving municipal fleet vehicles would have enormous value. First and foremost, it would save lives, prevent debilitating injuries, and increase the well-being of New Yorkers. Secondarily, it would help the City of New York save money on crash claims. For FY 2021, the City of New York paid out $130.1 million in claims for crashes involving City vehicles. If agencies could reduce crash claims by 20%, the City could save over $25 million per year – more than enough to cover the proposed budget cuts to New York City’s three library systems.[2] Preventing the most severe crashes – those that result in fatalities or life-altering injuries – is especially important, most urgently for the lives that can be saved, and because those crashes cost the most. The 169 crash claims settled for $1 million or more account for nearly 50% of payout costs.
The City can reduce claims resulting from severe crashes by implementing emerging fleet safety initiatives, reducing the number and size of vehicles in the City fleet, improving street design, and enhancing accountability for both drivers and agencies:
- Accelerate adoption of vehicle technologies and design features proven to reduce crashes. The use of advanced driver assistance systems (ADAS) in combination with safety-enhancing vehicle design features can improve fleet safety outcomes and prevent crashes before they happen. DCAS’ Safe Fleet Transition Plan, first rolled out in 2017, contains steps for upgrading fleet vehicles to reflect safety best practices. These interventions include:
- Procuring ADAS-equipped vehicles: ADAS refers to vehicle technologies that use cameras and sensors to avoid crashes by decreasing reaction times, applying brakes, or automatically slowing down. The Insurance Institute of Highway Safety (IIHS) has documented the efficacy of these technologies to improve safety outcomes. Automatic emergency braking technology (AEB) can reduce crashes up to 56% and reduced claim rates for injuries to other drivers by 24%. Pedestrian AEB, designed to detect and prevent collisions with people walking, reduced crashes by up to 30%.[3]When deployed on large trucks, AEB can reduce stopping distance by half in vehicles traveling up to 25 mph.[4] Other ADAS technologies, such as forward collision warning (FCW), blind spot warning (BSW), and lane departure warning serve similar purposes and prevent crashes by 10 to 20% in real-world conditions.
- The Safe Fleet Transition Plan requires all light-duty New York City vehicles purchased after 2017 to have AEB and include driver monitoring systems including FCW and BSW. As of early 2023, 1,467 vehicles representing just 6% of the City Fleet are AEB-equipped. Many of these vehicles also have FCW technology, although it is not separately tracked. While AEB is not available as a retrofit and can only be acquired on new vehicles, FCW can and should be applied as a retrofit on light and heavy-duty vehicles.
- The City’s successful adoption of sideguards on municipal trucks serves as a model for making fleet safety upgrades. Sideguards are barriers that can be retrofitted onto trucks to prevent pedestrians, cyclists, motorcyclists, and small cars from going under the vehicle in the event of a side-impact collision. City law requires sideguards on all large vehicles and waste collection trucks in the fleet and contracted by the City, as of January 1, 2023. As of December 2022, DCAS reports meeting this requirement, installing sideguards on the City’s 4,038 fleet trucks. Other key truck safety features, such as crossover mirrors and rear-impact guards, are considered standard and available on all heavy-duty vehicles. The City should set a similar goal to procure new ADAS-equipped vehicles or install retrofits where possible to reduce the risk of crashes.
- Deploying intelligent speed assistance (ISA): Vehicle speed is a key factor in determining the likelihood and severity of a crash. Vehicles traveling at higher speeds are more likely to cause crashes resulting in fatalities or serious injuries. ISA is a tool proven to reduce dangerous speeding resulting in crashes and fatalities by either alerting drivers when they exceed the posted speed limit or directly lowering a vehicle’s speed by making it harder to accelerate. Standard in new vehicles sold in Europe as of July 2022, widespread adoption of ISA could cut crashes by 30% and fatalities by 20%. In August 2022, the City launched a pilot initiative to deploy ISA on 50 non-emergency fleet vehicles across multiple agencies. An initial assessment of the pilot demonstrated that ISA-equipped vehicles stayed within the posted speed limit 99% of the time and reduced hard-braking incidents by 36%. An incoming federal grant will enable DCAS to expand the program to cover 7,500 non-emergency light and medium duty vehicles. In addition to these important steps, the City should consider deploying ISA on larger, heavier vehicles belonging to agencies most prone to crash claims.
- Set a minimum direct vision standard for fleet vehicles. While cameras, mirrors, and sensors can significantly enhance safety, they cannot replace direct vision. Large vehicles, such as SUVs, pick-up trucks, and heavy-duty trucks, often suffer from large blind spots and poor visibility from the driver’s seat. The Insurance Institute for Highway Safety documented that pick-up trucks are four times more likely, and SUVs are three times more likely, to cause a fatal crash when making a left turn because of visibility obstructions from inside the vehicle.[5] High vision cabs allow drivers to better see other road users with their naked eyes. This makes safe driving easier and eliminates blind spots associated with mirrors, cameras, and other forms of indirect vision. A Transport for London (TfL) study found that truck drivers in low-entry cabs who had a direct view of people and objects directly in front and to the side of their vehicle were involved in 40% fewer collisions than drivers in traditional cabs.[6]The adoption of direct vision standards for heavy trucks could yield major street safety improvements in New York City. The City of London adopted a minimum direct vision standard in 2021, requiring a minimum level of visibility from the driver’s seat for trucks operating within city limits. The program gives commercial trucks a rating between one and five stars based on their ability to see people around the vehicle. Vehicles that do not score at least two stars must be retrofit with safety improvements specified by TfL or cannot operate in London. New York can follow London’s example and implement a similar standard for fleet vehicles, enhancing safety while leveraging the City’s purchasing power to encourage the adoption and availability of high vision truck cabs more broadly. New DSNY trucks have direct vision features and DCAS’s Safe Fleet Transition Plan lists procurement of high vision truck cabs as a top priority citywide. The City should double down on this course and create a formal direct vision standard to evaluate the visibility levels of the current fleet and formalize a path towards making upgrades or retiring vehicles that cannot be upgraded to meet the standard.
- Reduce the number of vehicles in the City fleet. Reducing the number of vehicles in the City fleet can reduce claims and resulting payouts. Between FY 2012 and FY 2021, the number of vehicles in the City fleet grew by over 10%. In 2022, City Hall pledged to reduce the size of the fleet by 4%, which would require removing and auctioning off approximately 855 on-road, non-emergency vehicles by the end of the year. This step would revert the size of the City Fleet to where it was during the Bloomberg Administration. The City should follow through on this commitment and seek further opportunities to reduce the number of vehicles in the municipal fleet.
- Reduce the size of vehicles in the City fleet. Since 2010, the National Highway Traffic Safety Agency (NHTSA) has documented that heavier, high-front vehicles present increased safety risks to other road users.[7] The growing popularity of large passenger vehicles, such as SUVs and pick-up trucks, is directly related to the recent, nationwide spike in pedestrian and cyclist fatalities.[8] Heavier vehicles with higher hood heights tend to have larger blind spots and longer braking distances, making crashes more likely. Similarly, crashes involving large vehicles are more likely to result in fatalities and serious injuries. As noted above, our examination of claims data reveals that crashes involving larger, heavier City fleet vehicles result in larger settlements. On average, crashes involving trucks and vans led to settlements much higher, on average, than for smaller, city-owned vehicles. Given this pattern, the City should conduct a thorough evaluation of its need for large passenger cars and replace older vehicles with smaller models.
- Strengthen City driver accountability measures. City agencies can do more to hold its drivers accountable for responsible driving, and thereby prevent crashes. Drivers who run red lights or exceed speed limits are more likely to cause crashes. The City should lead on driver accountability by implementing an escalating set of consequences for employees who engage in reckless driving behaviors. When municipal vehicles trigger speed or red-light cameras, commit other traffic infractions, or are involved in crashes, the City should hold the driver accountable via a series of responses that escalate from remedial driver education to temporary to permanent suspension of City vehicle driving privileges.
- Enact City agency accountability measures. Settlement payments arising from crash claims (like other claims settlements) currently come out of the City’s General Fund rather than the budgets of the agency responsible. This practice leaves little incentive for agencies to reduce claims or change the practices from which claims arise. The City should instead place the budgeted allocation for projected settlement costs within each agency’s budget. The amount budgeted should be projected based on prior years’ trends. Agencies that reduce claims settlements below the projected amounts would be able to apply a portion of the savings towards the following year’s budget, while agencies whose claims exceed their projections would be responsible for covering the costs.
Appendix
Claims settled between FY12-FY21*
| FY | NYPD | DSNY | FDNY | DOT | P&R | DEP | Others | Total** |
|---|---|---|---|---|---|---|---|---|
| 2012 | 23 | 10 | 9 | 3 | 6 | 2 | 8 | 61 |
| 2013 | 135 | 61 | 64 | 9 | 14 | 4 | 30 | 317 |
| 2014 | 145 | 67 | 88 | 33 | 24 | 10 | 42 | 409 |
| 2015 | 143 | 105 | 98 | 15 | 20 | 14 | 39 | 434 |
| 2016 | 193 | 108 | 88 | 30 | 19 | 16 | 81 | 535 |
| 2017 | 227 | 112 | 102 | 32 | 20 | 11 | 63 | 567 |
| 2018 | 192 | 115 | 114 | 31 | 29 | 14 | 71 | 566 |
| 2019 | 199 | 148 | 111 | 28 | 16 | 19 | 52 | 573 |
| 2020 | 205 | 149 | 147 | 39 | 31 | 15 | 71 | 657 |
| 2021 | 186 | 106 | 130 | 24 | 20 | 16 | 55 | 537 |
*excludes legacy claims (claims filed prior to 2012)
**inclusive of all city agencies
Source: Office of the New York City Comptroller
Average settlement by agency: FY12 to FY21
| NYPD | DSNY | FDNY | DOT | P&R | DEP | Overall | |
|---|---|---|---|---|---|---|---|
| 2012 | $11,990 | $14,300 | $21,333 | $20,069 | $21,902 | $9,500 | $15,187 |
| 2013 | $18,743 | $16,040 | $16,761 | $10,333 | $15,500 | $24,821 | $17,428 |
| 2014 | $57,625 | $32,578 | $21,615 | $55,189 | $31,157 | $45,300 | $39,420 |
| 2015 | $48,742 | $62,283 | $59,138 | $12,833 | $196,130 | $39,964 | $62,971 |
| 2016 | $86,409 | $169,919 | $79,088 | $70,883 | $51,691 | $143,109 | $102,301 |
| 2017 | $153,664 | $249,500 | $69,060 | $82,508 | $171,750 | $173,818 | $154,816 |
| 2018 | $156,971 | $373,509 | $97,987 | $168,927 | $95,603 | $46,143 | $177,615 |
| 2019 | $181,381 | $163,446 | $97,535 | $130,411 | $290,031 | $426,395 | $168,469 |
| 2020 | $323,443 | $161,622 | $133,466 | $120,346 | $259,065 | $128,007 | $204,295 |
| 2021 | $240,616 | $310,750 | $172,042 | $260,222 | $229,080 | $528,281 | $242,365 |
Source: Office of the New York City Comptroller
Agency Fleet Size FY12-FY21
| FY12 | FY13 | FY14 | FY15 | FY16 | FY17 | FY18 | FY19 | FY20 | FY21 | |
|---|---|---|---|---|---|---|---|---|---|---|
| NYPD | 8,646 | 7,913 | 8,323 | 8,882 | 9,240 | 9,666 | 10,110 | 9,967 | 9,824 | 9,369 |
| DSNY | 5,532 | 5,574 | 5,810 | 5,857 | 6,060 | 6,107 | 6,253 | 6,121 | 5,988 | 5,946 |
| DOT | 2,693 | 2,581 | 2,787 | 2,766 | 3,065 | 3,231 | 3,318 | 3,430 | 3,488 | 3,444 |
| FDNY | 2,211 | 2,062 | 2,143 | 2,097 | 2,289 | 2,367 | 2,487 | 2,426 | 2,351 | 2,249 |
| DEP | 2,075 | 1,943 | 2,019 | 1,999 | 2,176 | 2,164 | 2,239 | 2,297 | 2,301 | 2,117 |
| DPR | 2,485 | 2,523 | 2,954 | 2,923 | 2,916 | 2,909 | 2,897 | 2,840 | 2,777 | 2,834 |
| City Fleet | 28,713 | 25,855 | 27,300 | 27,844 | 29,374 | 30,037 | 31,002 | 30,755 | 30,502 | 29,718 |
Source: Mayor’s Management Report FY 2012 to FY 2021
Acknowledgements
Sindhu Bharadwaj, Senior Policy Analyst, was the lead author of this report with support from Annie Levers, Assistant Comptroller for Policy, Robert Callahan, Director of Policy Analytics, Dan Levine, Data Policy Analyst, Louise Yeung, Chief Climate Officer, Justina K. Rivera, Esq., General Counsel and Deputy Comptroller for Legal Affairs, Seunghwan Kim, Assistant Comptroller for the Bureau of Law and Adjustment, and Adam Karp, Director, Tort Claims, Bureau of Law and Adjustment. Report design was completed by Archer Hutchinson, Graphic Designer.
Endnotes
[1] New York City’s budget process follows the fiscal year, beginning on July 1st and ending on June 30th.
[2] The City of New York (2022, November). Program to Eliminate the Gap (PEG). November Financial Plan. Retrieved from www.nyc.gov/assets/omb/downloads/pdf/peg11-22.pdf.
[3] Insurance Institute of Highway Safety. (2022, March). Real-world benefits of crash avoidance technologies. IIHS. Retrieved from https://www.iihs.org/media/290e24fd-a8ab-4f07-9d92-737b909a4b5e/4GauQQ/Topics/ADVANCED%20DRIVER%20ASSISTANCE/IIHS-HLDI-CA-benefits.pdf.
[4] Chiarenza, J., Welty, K., Fisher, D., Epstein, A. K., & Dawes, M. (2018, December). Optimizing Large Vehicles for Urban Environments. Retrieved from www.nacto.org/wp-content/uploads/2018/12/NACTO-Volpe-Optimizing-Large-Vehicles_ADAS.pdf
[5] Insurance Institute of Highway Safety. (2022, March 17). SUVs, other large vehicles often hit pedestrians while turning. IIHS. Retrieved from www.iihs.org/news/detail/suvs-other-large-vehicles-often-hit-pedestrians-while-turning.
[6] Milner, R., & Western-Williams, H. (2016, September 15). Exploring the Road Safety Benefits of Direct vs Indirect Vision in HGV Cabs. Retrieved from content.tfl.gov.uk/road-safety-benefits-of-direct-vs-indirect-vision-in-hgv-cabs-technical.pdf
[7] National Highway Traffic Safety Administration. (2015). Docket No. NHTSA–2015–0119: New Car Assessment Program. Federal Register. Retrieved from www.govinfo.gov/content/pkg/FR-2015-12-16/pdf/2015-31323.pdf.
[8] Insurance Institute of Highway Safety. (2020, June 16). New Study suggests today’s SUVs are more lethal to pedestrians than cars. IIHS. Retrieved from www.iihs.org/news/detail/new-study-suggests-todays-suvs-are-more-lethal-to-pedestrians-than-cars.