
Logging Industry in the United States: Employment and Profitability


1
School of Forestry and Wildlife Sciences, Auburn University, Auburn, AL 36849, USA
2
Forest Operations Research Unit, Southern Research Station, USDA Forest Service, Auburn, AL 36849, USA
3
Agricultural Economics & Rural Sociology, College of Agriculture, Auburn University, Auburn, AL 36849, USA
*
Author to whom correspondence should be addressed.
Forests 2021, 12(12), 1720; https://doi.org/10.3390/f12121720
Submission received: 10 October 2021
/
Revised: 2 December 2021
/
Accepted: 3 December 2021
/
Published: 7 December 2021
(This article belongs to the Section Forest Economics, Policy, and Social Science)
Abstract
:This study analyzed logging industry employment and profitability in recent decades in the U.S. based on Occupational Employment Statistics (OES), Quarterly Workforce Indicators (QWI), Quarterly Census of Employment and Wages (QCEW), and Timber Product Output (TPO) Reports. The logging industry in the U.S. has experienced reduced employment with an aging workforce over the past two decades. The changes might be related to increased productivity from mechanization, combined with reduced demand for logging, but estimates of capital and labor productivity for logging are not available. To overcome the data limitation, a simple and cost-effective economic model, Economic Input-Output Life Cycle Assessment (EIO-LCA) Model, was applied to estimate the profitability of the entire industry at a state level. It was found that the reduced demand and increased operating costs led to poor profitability and a wave of closures of logging firms but also accelerated the adjustment in the logging industry. Serious challenges facing the forestry sector include the lack of an effective monitoring tool for the logging industry, structural shortage of logging labor, and rising operating costs.
1. Introduction
With technological advancements, policy changes, parcelization of forestland, business cycles, and the change of relative costs of factors, the labor force of the logging industry in the world has undergone dramatic changes in the past few decades [1,2,3,4,5], especially in the U.S. [6]. Employment in the U.S. logging industry is concentrated in the West and the South, which experienced large declines in employment. The employment decline was likely related to the change in the age distribution of the loggers [7,8]. Survey results from various studies have indicated an increase in the mean and median age of logging business owners and employees [9,10,11,12,13,14,15]. The logging industry in Canada is also facing a similar situation [16]. These authors discuss the importance of the age imbalance in logging, and many U.S. industries face an aging workforce as the Baby Boomer generation nears the retirement age [17,18,19,20].
Since logging wages have increased at about the rate of inflation and the interest rate remains low, logging firms continue to mechanize in many countries [2,21,22,23,24]. In the U.S., Capital investments were mostly used for harvesting and transportation equipment, in addition to buying stumpage [16]. Early in the 2000s, the initial investment of logging firms was between $0.4 million to $1.5 million [25]. By the mid-2010s, the average equipment investment of Georgia logging firms was $1.97 million, and $2.23 million for South Carolina firms [26]. However, demand for logging workers continues despite mechanization [27]. U.S. logging firm owners have indicated that recruitment of qualified employees was a challenging aspect of managing their business [11,28], as well as for their counterparts in New Zealand [4,29].
On one hand, changes in employment and mechanization affect the cost of logging and profit, while, on the other, firm profitably affects employment and mechanization [30,31]. In some U.S. firm-level surveys, the profits of logging firms were decreasing [10,32,33], while other surveys in other regions showed the profits still increasing or at least stable [12,25,34]. However, the acquisition of the profit data is solely based on the questionnaires issued to the selected firms. Due to time and budget constraints, only a few surveys were conducted, and the accuracy of self-reported firm financial data is unknown. The limits of survey data and the lack of industry-level data obscure our understanding of logging industry profitability. Therefore, a simple and cost-effective economic model to estimate the profit for the industry would be valuable to investigate the factors affecting profit and how changes in profit affect the operational behavior of logging firms and would provide information for policy makers.
Previous research data from logging firms were collected selectively and focused on aspects of the logging industry such as demography, employment, harvesting systems, production level, operational costs, and/or profitability. The analyses were beneficial for the research in the logging industry. However, they failed to identify the overall situation and trends. Conflicting conclusions drawn from these analyses might be traced to sample size effects or regional differences. This paper adds both firm-level data from previous research with federal- and state-level data, providing additional evidence for industry-level trends and relationships.
This study focused on the two major core factors related to business in the logging industry: labor and firms. The objective of this paper was to provide a quantitative analysis of U.S. logging industry data and present trends in employment and profitability over the last 20 to 30 years. The results of the study will help us better understand the factors influencing the U.S. logging industry.
2. Data and Methodology
2.1. Study Area
The study area included regional and state data from New England (Connecticut, Maine, Massachusetts, New Hampshire, Rhode Island, and Vermont), the Mid-Atlantic (Delaware, Maryland, New Jersey, New York, and Pennsylvania), the South (Alabama, Arkansas, Florida, Georgia, Kentucky, Louisiana, Mississippi, North Carolina, South Carolina, Tennessee, Virginia, and West Virginia), the Midwest (Illinois, Indiana, Iowa, Kansas, Michigan, Minnesota, Missouri, Nebraska, North Dakota, Ohio, South Dakota, and Wisconsin), the Southwest (Arizona, New Mexico, Oklahoma, and Texas), and the West (Alaska, Colorado, California, Hawaii, Idaho, Montana, Nevada, Oregon, Utah, Washington, and Wyoming).
The main interest of this paper was to study the industry-level situation and trends in the logging industry. Therefore, we selected indicators for the logging industry using official estimates of employment, wage, number of establishments, production level, and production price of the logging industry (Code 1133 North American Industry Classification System, NAICS) at the state level from U.S. Bureau of Labor Statistics, U.S. Census Bureau, and U.S. Department of Agriculture, Forest Service. The logging industry (NAICS 1133) comprises firms primarily engaged in cutting timber; producing rough, round, hewn, or riven primary wood; cutting and transporting timber; and producing wood chips in the field [35].
2.2. Data Sources
Specifically, we extracted the data for the logging industry from Occupational Employment Statistics (OES), Quarterly Workforce Indicators (QWI), Quarterly Census of Employment and Wages (QCEW), Timber Product Output (TPO) Reports, and Producer Price Index (PPI). Due to the availability of data, the analysis presented in this paper focused on the period from 1997–2019.
The OES program collects data on wage and salary workers in nonfarm establishments for about 800 occupations, including national and state annual employment, hourly wage, and annual wage data. The OES survey is a semi-annual mail survey of nonfarm establishments [36]. The data are classified by the Standard Occupation Code (SOC) and NAICS Code. The data extracted from OES included state-level employment, mean hourly wage, and annual mean wage data of Fallers, Logging Equipment Operators, Log Graders and Scalers, Logging Workers, and All Others from 1997 to 2019 [37].
The QWI has a set of 32 economic indicators, including employment, job creation/destruction, wages, hires, and other measures of employment flows. The QWI data are based on the administrative records on employment collected by the states, social security data, federal tax records, and other census and survey data. The QWI data set includes quarterly national and state employment and wage data for most industries. Application Programming Interfaces (APIs) can be applied to extract QWI data via Python, R, or Excel. The package “CenPy” was used to run APIs from QWI on Python and Library “tidyqwi” on R. The data extracted from QWI included information like state-level employment data from 1997 to 2017, state-level employment by age classes in 1997, 2007, and 2017, state-level monthly earnings of newly stable employees in the logging industry and all industries in the U.S. from 1997 to 2019, and state-level total quarterly payroll from 2001 to 2019 [38].
The QCEW publishes a quarterly count of employment and wages reported by employers covering more than 95% of the U.S. jobs available at the county, state, and national levels by detailed industry. The QCEW data are collected from the unemployment insurance (UI) accounting system, Quarterly Contributions Report (QCR), Report of Federal Employment and Wages, Annual Refiling Survey (ARS), and Multiple Worksite Report (MWR). However, QCEW excludes sole proprietors, the unincorporated self-employed, unpaid family members, and specific farm and domestic workers from having to report employment data, which likely reduces the representativeness of the data set [39]. Data from QCEW can be extracted through the One-Screen Data Search [40]. The State-level Number of Establishments in the logging industry (NAICS 1133) from 2001 to 2015 were also extracted from QCEW [41].
TPO is conducted by Forest Inventory and Analysis (FIA) to estimate timber products at the state level. Primary wood-using mills were sampled, by state, to estimate roundwood production [42]. However, TPO only covers some states and some years. The state-level total volume of roundwood products from 1997 to 2018 was extracted from the TPO data set [43]. PPI data by NAICS Industry can be extracted at the one screen tool [44]. However, the PPI data set does not have any state-level data. The national PPI for NAICS 1133 from 1997 to 2018 was extracted from PPI by Industry.
2.3. Methodology
We used OES data to calculate the compound annual rate of growth with regards to the total hours worked in the logging industry at the state level and used TPO data to calculate the compound annual rate of growth with regards to the volume of output in the logging industry at the state level. Considering that the volume of output cannot reflect the improvement of product quality, we introduced the price factor, PPI, in the logging industry with an index base set at 1981 = 100 [45]. The volume output multiplied by PPI expressed the value of output, which was used to estimate the labor productivity [46]. The rate of growth in labor productivity based on volume of output is equal to the compound annual rate of growth in the volume of logging production minus the compound annual rate of growth in hours worked. Additionally, the rate of growth in labor productivity based on value of output is equal to the compound annual rate of growth in the economic value of logging production minus the compound annual rate of growth in hours worked.
Considering the difficulty of collecting profit data and the lack of profit statistics at the federal or state level, we applied a new method to simply estimate the profit of logging firms, which was the Economic Input-Output Life Cycle Assessment (EIO-LCA) Model. EIO-LCA models are based on the environmental Input-Output (I/O) modeling approach [47] and are developed by Carnegie Mellon University [48]. EIO-LCA models were applied to estimate the materials and energy resources required for the supply chain, environmental emissions, and economic values. In EIO-LCA models, the output of the first tier of suppliers, , is given by Equation (1):
where I is the identity matrix, y is the final demand, and A is the matrix of intermediate input coefficients. Equation (1) means the sector and all other sectors need to produce I × y and A × y units of production, respectively, to meet the demand [49].
The output of the first tier of suppliers also creates a demand for output from their direct suppliers, the second tier of suppliers. The final demand of the second tier of suppliers is A × A × y. Consequently, the final demand of the third tier of suppliers is A × A × A × y, and so on. Thus, the total output can be written as:
where X is a vector of total output.
The intermediate input coefficients . can be calculated by Equation (3):
where . is the intermediate transaction from industry i to industry j and . is the total input of industry j.
3. Results and Discussions
3.1. Employment
Declining employment is a problem endemic to the logging industry and experienced in all industrialized countries [52], such as Canada [2] and Europe [3] with a similar situation in the U.S. The regional employment declined from 1997 to 2017 (see Table 1), and employment in the whole country fell at an annual rate of 2.0% [38]. The Southwest region experienced the fastest decline of all six regions with a decrease of 3.9%. The Mid-Atlantic had the lowest employment and the second-fastest regional decline. The South, which had the highest employment, had a decline near the U.S. total, at −1.8%.
The lack of newly hired workers is one of the main reasons presented for declining employment [14]. One proposed cause of the decline in the number of younger loggers has been the relatively low appeal of logging employment and business creation [10]. The surveys attributed difficulties in recruiting to uncertainty and instability concerning business outlook and seasonal operations [28,33,53]. Logging jobs are physically demanding, mostly outdoors, and require work in poor weather and isolated areas [54]. Higher compensation may be required to attract new employees. However, over the years, the wages of newly hired employees in the logging industry have been almost the same as the average for all industries in the U.S., and in some years, even lower (Figure 1), while other industries can offer higher pay, better benefits, and more steady work [33].
Due to the abovementioned situation, some logging firms hire foreign workers instead. In northern Maine, the logging firms relied on workers from Québec, Canada [55]. In the South, it was estimated that Hispanic workers accounted for 3.37% of the total logging workers. They are concentrated in Arkansas and North Carolina [56]. Foreign workers in logging employment entered the U.S. through the H-2B visa program, temporarily importing non-agricultural guest workers [57], and, later, through the H-2A program after 2008 [58]. It was found that some undocumented foreign workers also engaged in logging, but some of them might transfer to the legal program because the logging firms shifted to legal labor [59]. The low job quality of logging might increase the number of foreign workers, and recruiting foreign workers might partly offset the decline in employment in the logging industry and save costs [60]. However, this also caused opposition from domestic logging workers. They argued that the foreign workers took jobs that should be going to domestic citizens and were depressing wages [55].
The age class of the employees reflected the expansion of the industry into the mid-1990s followed by a steady decline. The mode age class shifted from 35–44 in 1997 to 45–54 (28%) by 2007. By 2017, age classes 45–54 (25%) and 55–64 (22%) had similar employment. The 55–64 age class showed relatively large growth from 2007 to 2017, increasing from 10% to 22% (Figure 2). The population in the U.S. had a similar trend and those aged 55 and older accounted for 26.7% and 36.7% in 1999 and 2019, respectively [26]. The shift in age coincided with the decline in employment; so, the shift may result from the aging of current workers and the limited demand for new labor.
Technical advancement is another main reason for declining employment. We estimated the rate of growth in labor productivity of some states in the South, Southwest, and the West (Table 2). The Volume of Output column and the Value of Output column are the rate of growth in the volume of logging production and the economic value of logging production, respectively. The Hours Worked column is the rate of growth in hours worked. Except for Tennessee and Oregon, both rates of growth in labor productivity were positive. The output and hours worked declined in most states since 1997, but output declined at a slower pace than hours worked, which led to labor productivity growth. These findings are consistent with the studies in Uruguay, Argentina, Brazil [22], New Zealand [4], and Nordic countries [21].
Although the employment in the logging industry declined, the number of logging equipment operators remained stable, from 22,690 in 2002 to 21,110 in 2019. The fallers declined, from 8410 in 2002 to 3180 in 2019. According to SOC codes, fallers (45-2021) use motor-manual methods (chainsaws) to fall trees [61]. The change could indicate an increase in mechanization or increased productivity caused by equipment upgrades or be related to changes in the terrain and forest types where timber harvesting occurred. The two states with declining productivity in Table 2 also might be characterized as somewhat dependent on motor-manual felling. However, similar states such as Washington and Kentucky had growth. Although mechanization can replace labor, the logging industry might also face a structural shortage of labor. This industry did not lack workers, but the availability of skilled and technical workers may be limited. For example, it may take a new worker a year to master forwarder operation, including time on simulators [62]. With the progress of mechanization, logging firms increasingly needed equipment operators but faced difficulties in recruiting qualified employees [11]. This situation also occurs in Europe [63,64,65,66] and New Zealand [67].
As the data in Table 2 indicate, the production level decreased in most states across this time. Most of the major states for logging, such as most southern states, had varying degrees of decline in output and corresponding declines in employment. A small number of states, Florida, South Carolina, and Oregon, had increased harvest level, but employment declined.
3.2. Profitability
Figure 3a,b shows the results of the logging EIO-LCA models with the inflation-adjusted profits of logging firms and profits per logging firm (2019 Constant-dollar) in several states. From 1995 to 2009, the real profit and weighted average profit made by logging firms in these states continued to decline, reaching the lowest point in 2009 because of the economic recession.
Demand for logging services is highly dependent on the economic cycle. The amount of timber harvested has largely been impacted by the demand for wood-frame housing [68] and the pulp, paper, and furniture industries in the past decades [9,69]. When the economy is in boom periods, demand for construction, house renovation, and furniture stimulate the demand for logging production, which in turn promotes the increase in prices and then the logging output. During an economic recession, logging suffers a sharp drop in profits due to the decline in demand and then prices. Their European counterparts are also facing the same situation [66,70].
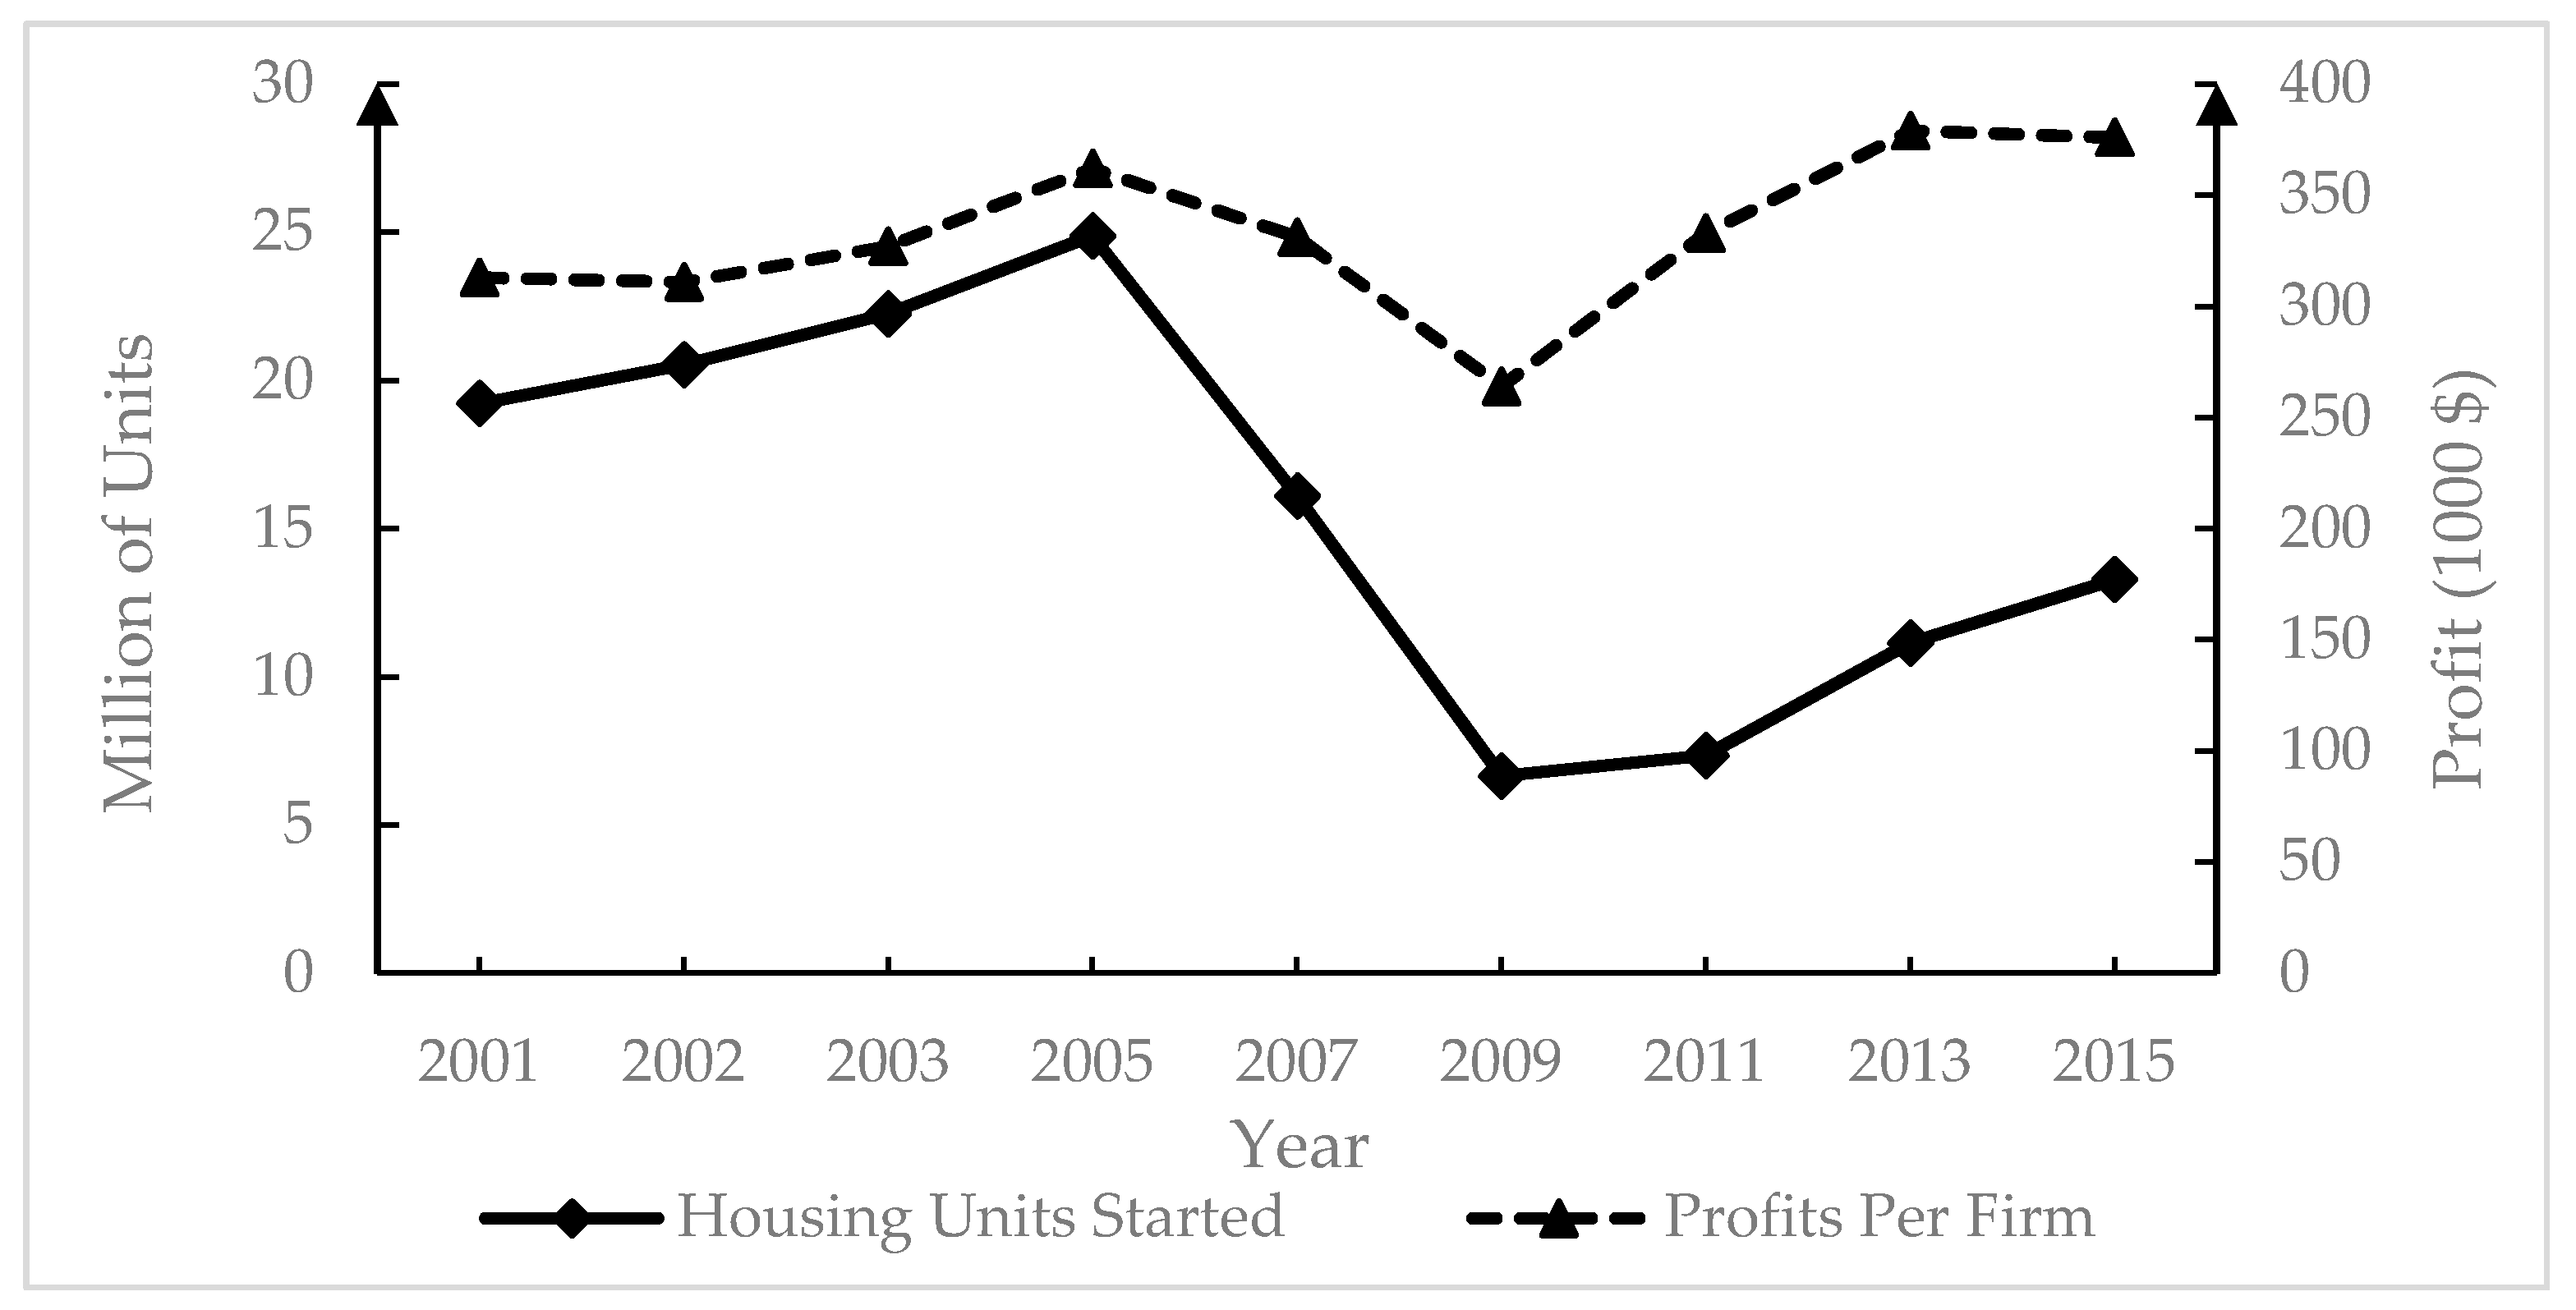
Figure 4 demonstrates the relationship between the annual new private-owned housing units started in the U.S. and profit per logging firms. The new housing started can be applied as an indicator of demand for logging production. It can be observed that there is a positive correlation between profit and the new housing, as depicted in Figure 4. The new housing units started to reach their lowest point at 6648 in 2009 because of the economic crisis of 2008. Meanwhile, the profit also reached its lowest point. Following the economic crisis, the demand for housing began to increase, which was reflected in logging profit. Although the profit and new housing units had the same tendency after 2009, the profit decreased more than the new housing units during the recession and did not return to the level before the recession, making them not less correlated after 2009. This may result from the increasing operating costs, which squeezed the profit.
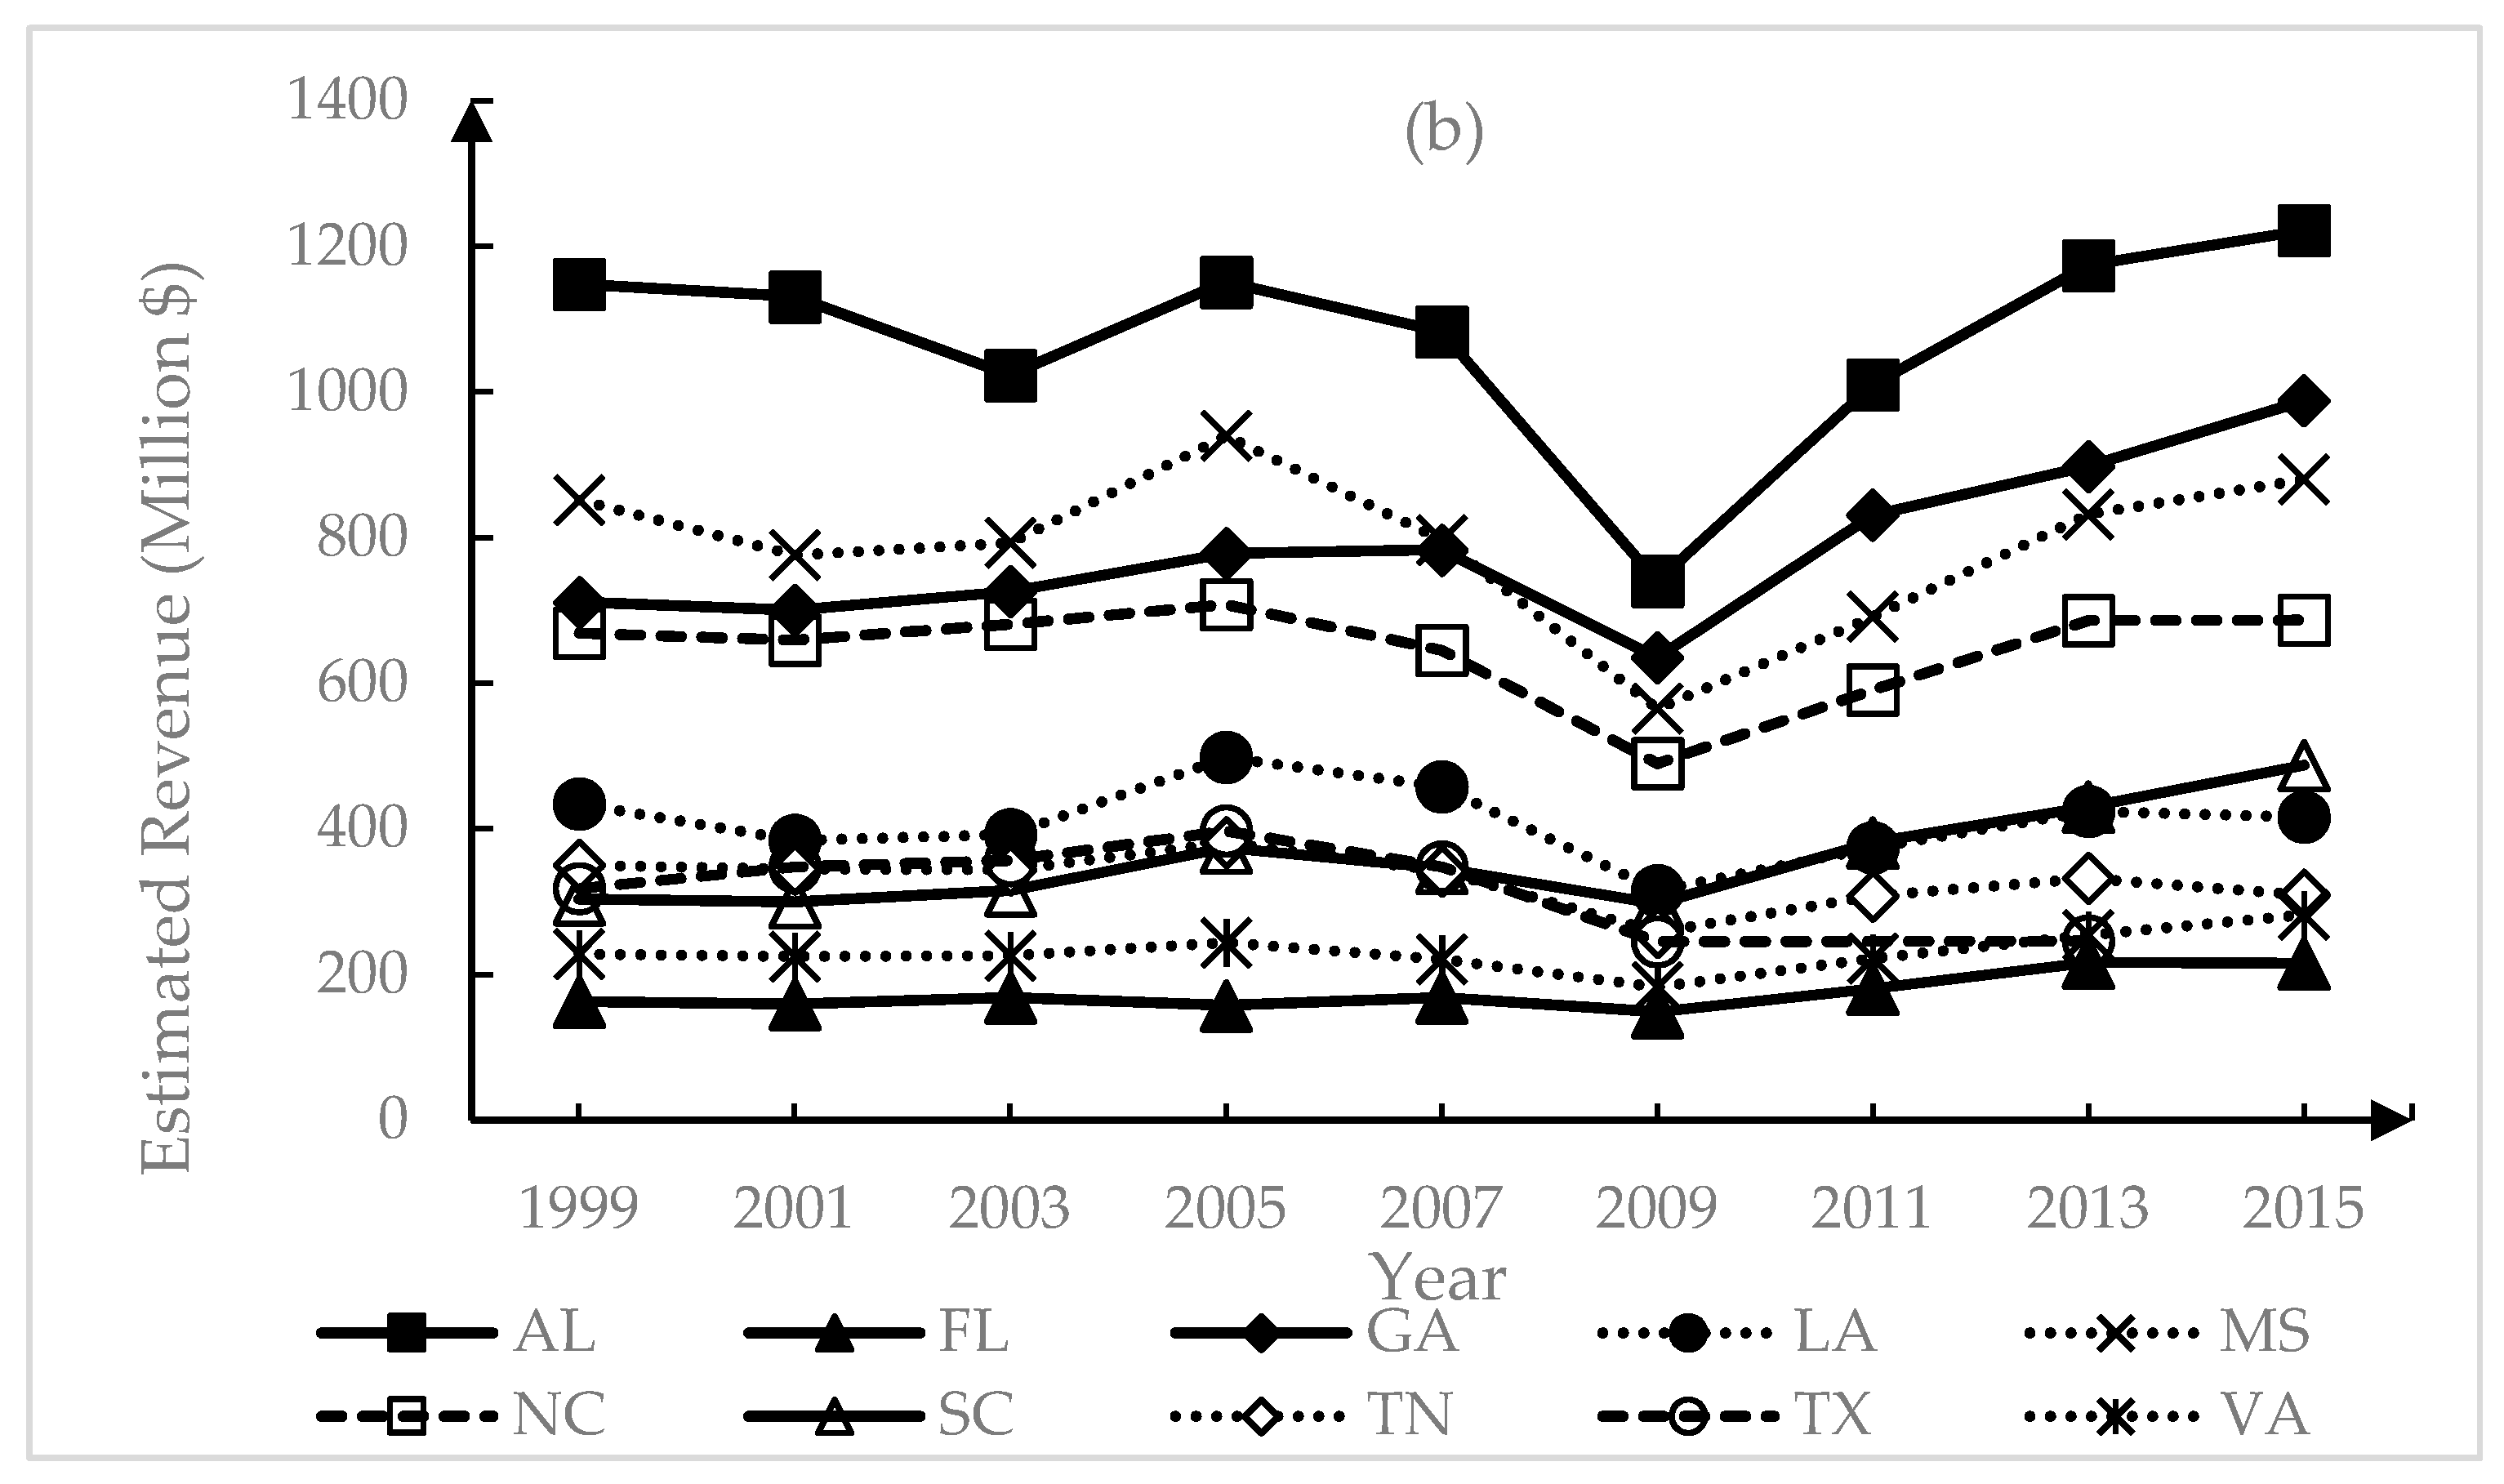
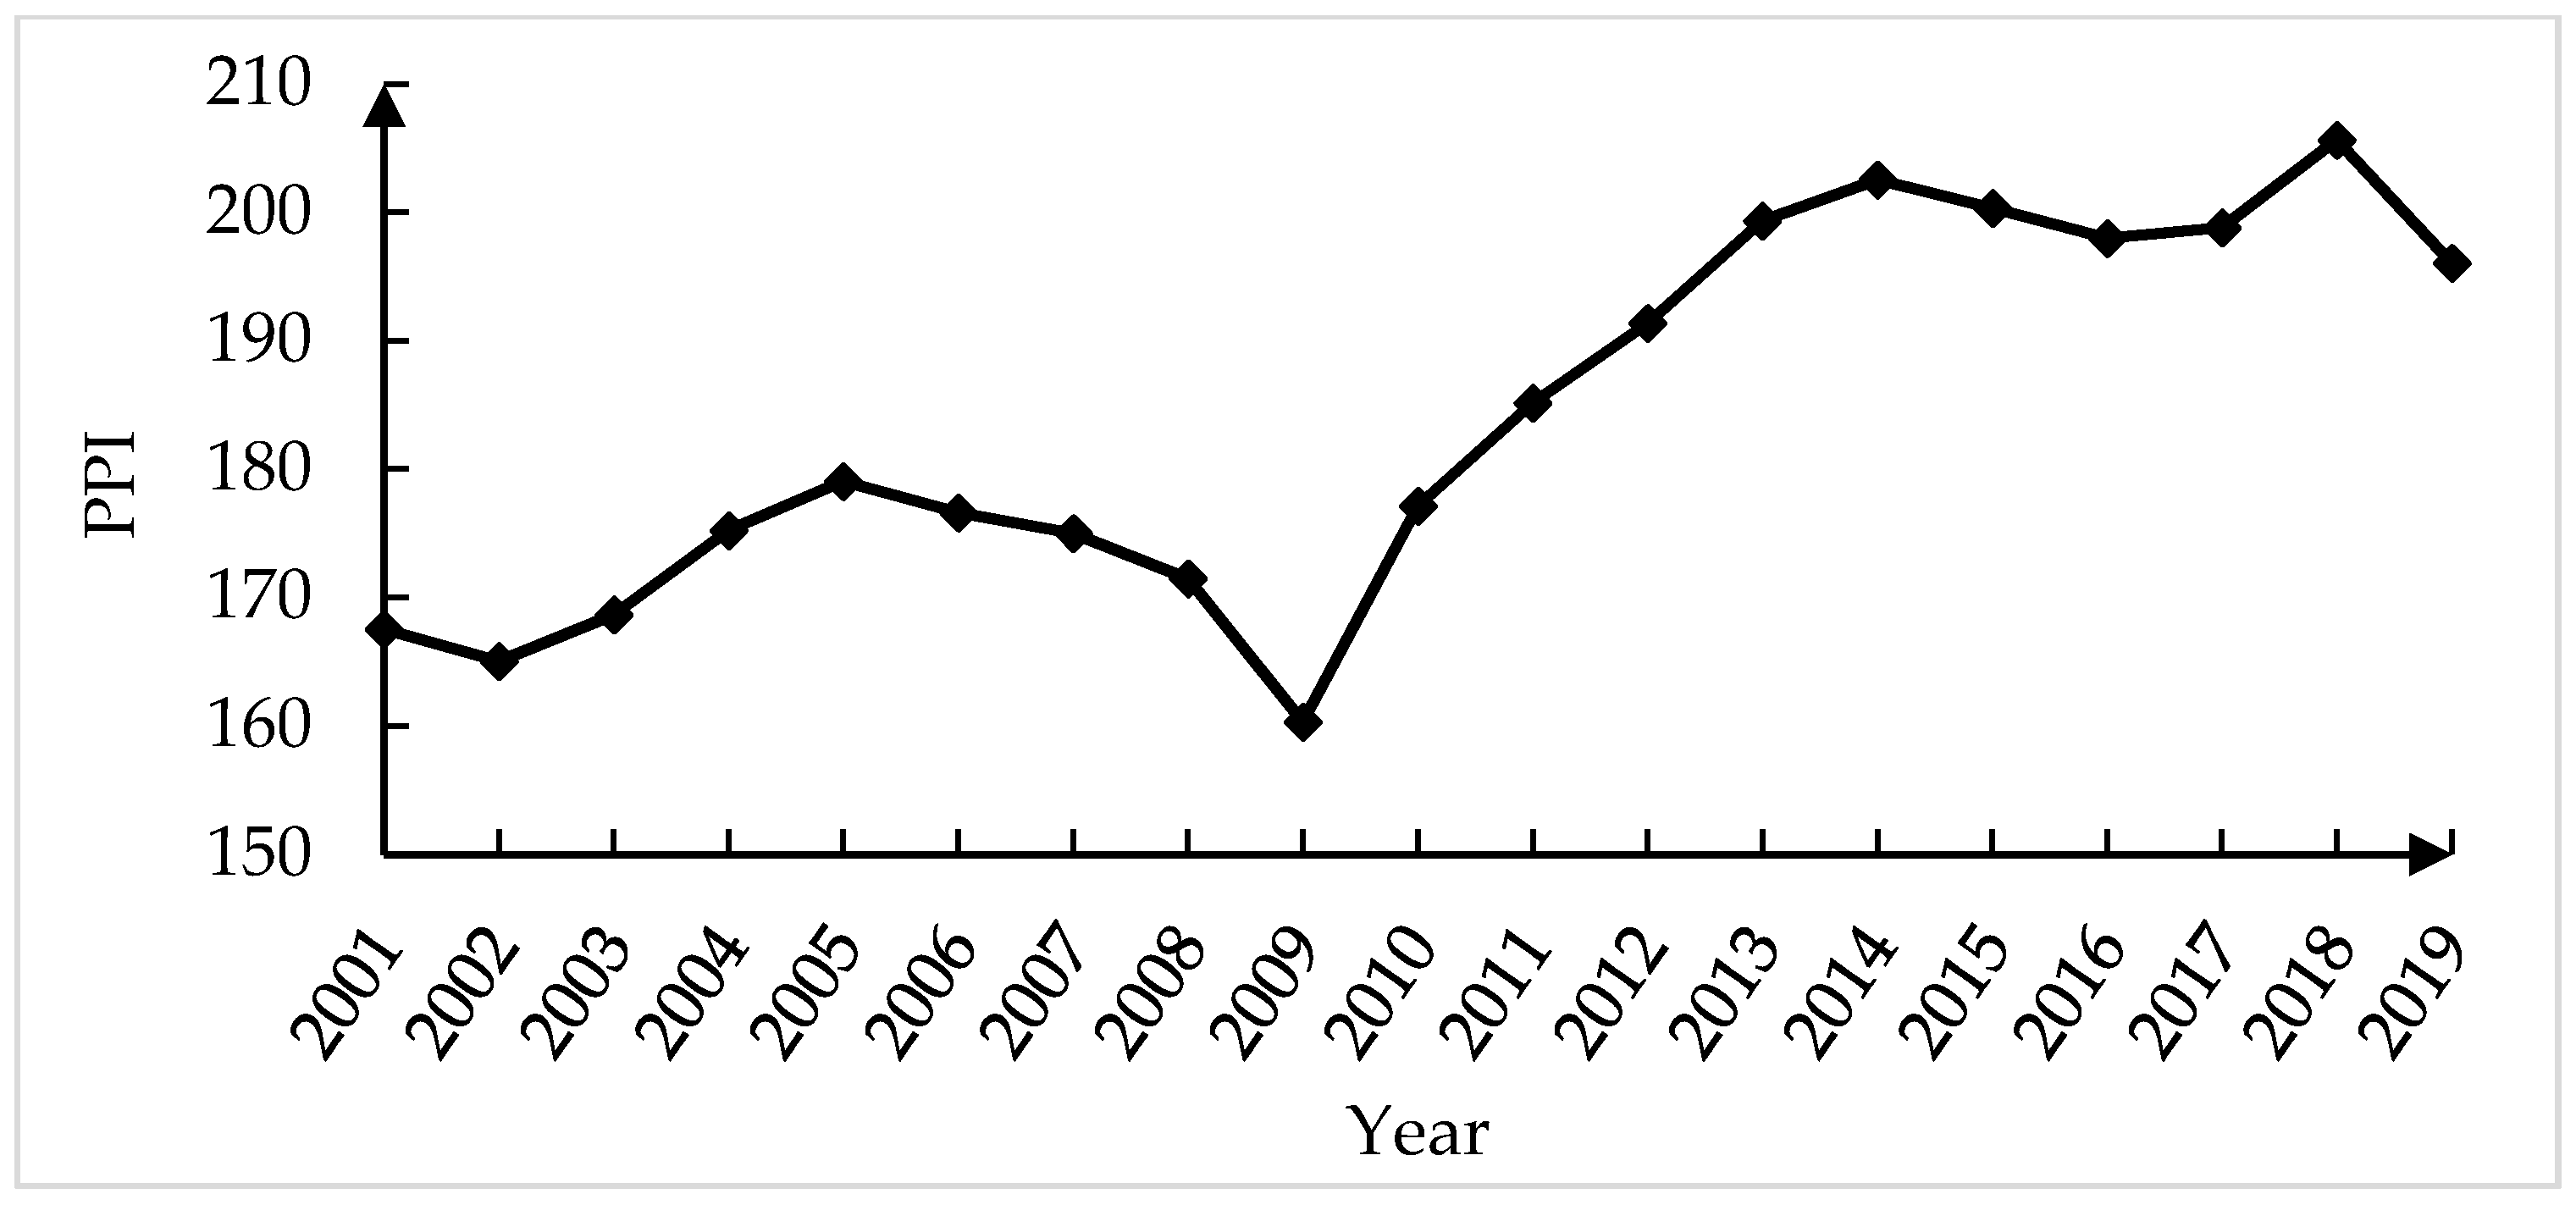
The data show that the production level of all the states in 2009 dropped sharply (Figure 5a), and the Annual PPI of Logging also showed a decrease (Figure 6) due to the 2008 economic recession. Revenues from the logging industry in several states fell sharply in 2009 and then began to rebound (Figure 5b), indicating that the revenue of logging services was seriously affected by the economic recession. From the comparison of these indicators, we can infer that the economic cycle had an impact on demand for logging production, which then affected the price and production level of firms, finally influencing both the revenue and the profit. These findings are similar to the findings in Canada [2,73] and Europe [74].
Increasing operating costs (e.g., insurance premiums, wages, logging equipment, and fuel costs) also reduced profit [32,76]. This challenge was also found in Canada [2] as well as in Europe [21,23,24]. Logging firms have operating costs as a combination of internal costs with labor, capital, and operating cost components, which can be observed in Figure 7a,b.
We projected that wage and profits had a relatively negative correlation, as in Figure 7a. For example, from 2002 to 2005, the real wages fell, while profits rose. When wages reached a low point in 2005 and 2013, profits reached high points, which indicated logging firms lacked profit-sharing distributions with their employees.
Figure 7a also showed that wage accounted for a larger proportion of total costs. In the South, the wage accounted for more than 30% of the total costs [78]. Nominal wages in the logging industry increased by 3.73 times since 1977, with an average annual increase of 3.18% [79].
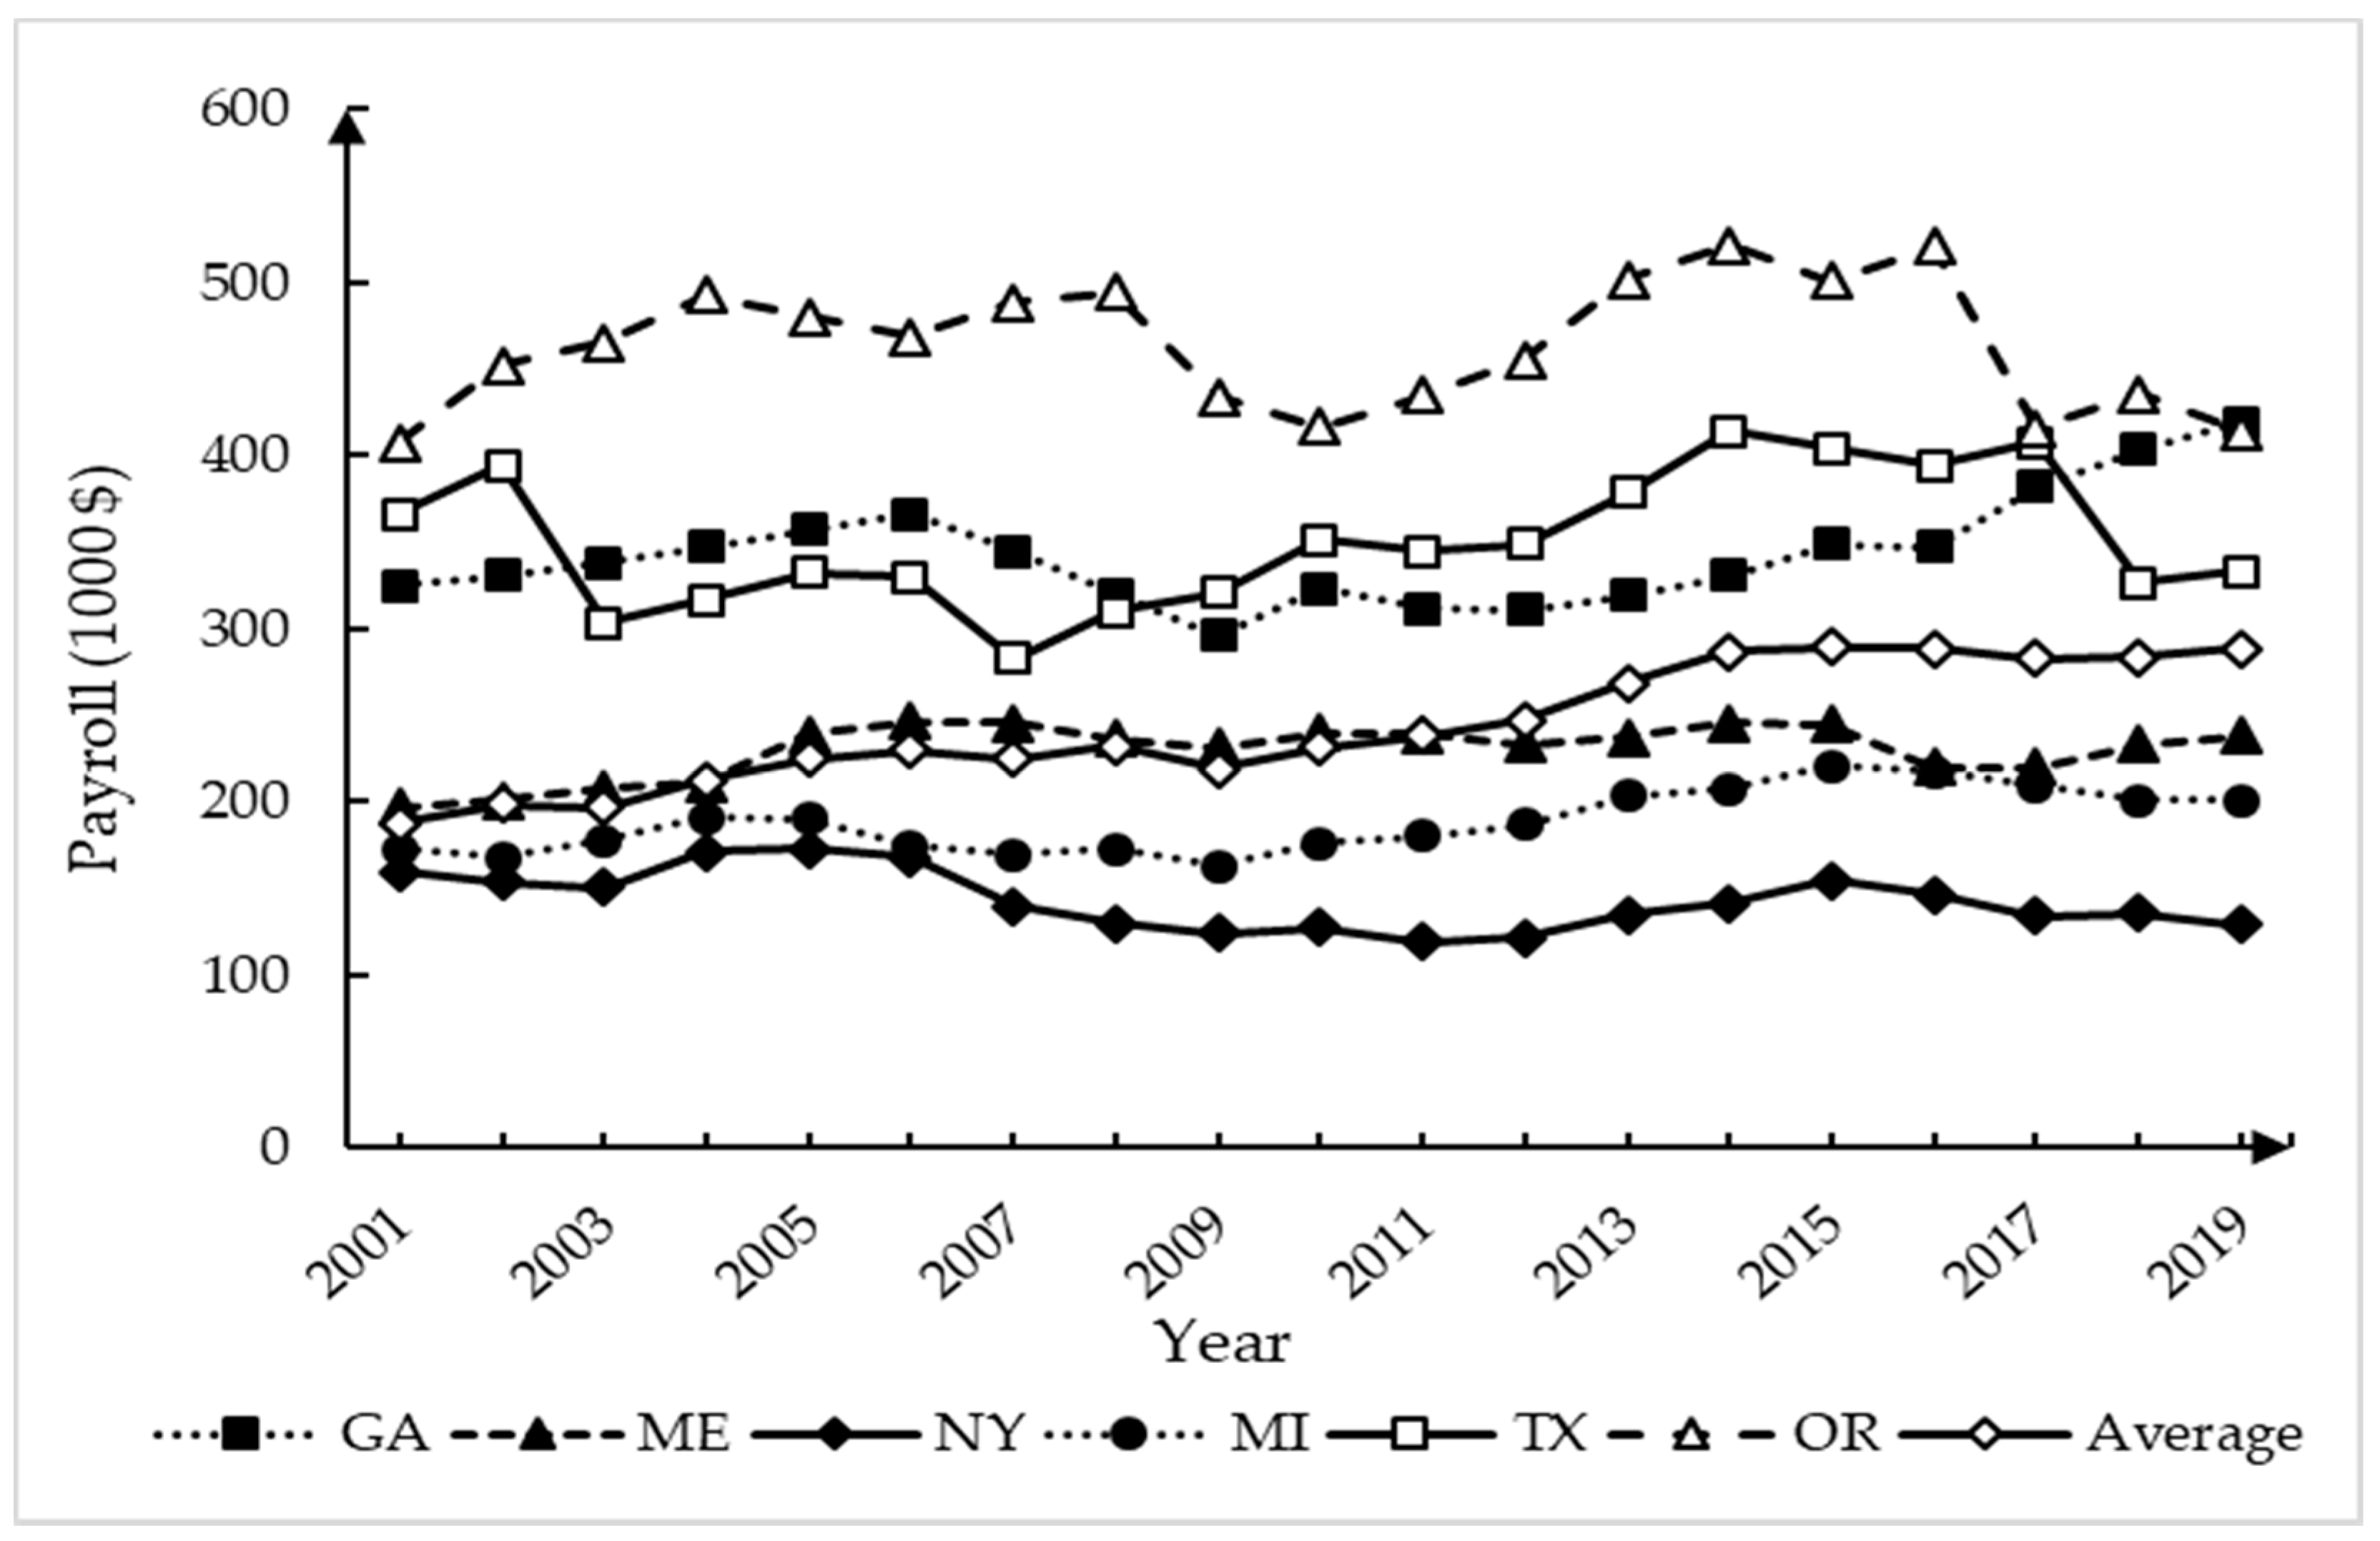
We selected the states with the largest employment in the six regions and estimated the annual inflation-adjusted payroll (2019 Constant-dollar) paid by per logging firms in these six states from 2001 to 2019 (Figure 8). Real payroll per firm in these states rose from 2001 to 2016, except for New York, which remained stable. Unlike the demand for logging production and prices, real payroll per firm in these states was not greatly affected by the economic recession. After 2016, real payroll per firm in Oregon and Texas fell sharply, but the average of these six states increased steadily from 2001 to 2019. The increase in payroll was coincidental with the change in labor productivity. The average growth in labor productivity (volume) of sample states was 1.6%, while the labor productivity (volume) of Texas alone was 0.8% and that of Oregon was −2.8% (Table 2).
Figure 7b depicts a similar relationship between capital and profit. Capital stock per ton production increased sharply in 2009. The decline in production level, which resulted from economic recession, led to an increase in unit capital stock. This also implies an increase in unit capital expenditure because some capital expenditures are fixed costs and will not decrease as the production level decreases. This also shows that the sharp decline in profits in 2009 was not only due to changes on the demand side but also due to constant labor costs and capital expenditures, which led to an increase in unit costs and squeezed profits. Transportation costs also rose over the period, including driver wages, log truck insurance, and transportation rates [26,80].
After 2009, real profit rose (Figure 3a). Low profit, resulting from low demand and rising costs, was previously an important reason for firm owners to leave the logging industry [81]. The number of logging firms had been decreasing, and the recession starting in 2008 accelerated this process. In the short run, logging firms would run without making a profit if they could cover variable costs to meet cash flow demands. In the long term, logging firms would use unprofitable jobs to bridge the gap between profitable jobs, especially when idling the business would result in greater losses [82].
With the reduction of profit and the impact of the 2008 economic recession, logging firms closed. However, the economic recovery increased demand while the number of logging firms still fell, leading to the rising market prices. The average firm profits were also restored to the pre-recession level (Figure 3b). Thus, despite rising costs, increased profit began to attract new firms to enter the logging industry. The number of logging firms in some states stopped decreasing in 2015 and started to increase slightly [41].
3.3. General Discussion
While it appears the declining employment resulted from the unavailability of newly hired workers [14], the more fundamental cause can be technological advancement represented by mechanization and the decline in the demand for logging production. We believe the decline in employment due to the inadequacy of newly hired workers is a short-term issue, whereas mechanization tends to be a long-term one. This is consistent with other studies [8,10,13,16]. Recruiting foreign workers might partly offset the decline in employment, but it would also cause opposition from domestic logging workers. Additionally, the inadequacy of newly hired workers results in the continuously aging workforce, which Canada is also facing [16].
The labor shortage in the logging industry is a structural shortage, not a lack of labor, but a lack of skilled and technical workers. The structural shortage of labor will be a serious challenge for the logging industry. Logging firms are making up for the labor shortage through mechanization. However, mechanization also means increasing the qualifications of required workers. However, based on the reality of a continuously aging workforce and the decline of younger workers entering, finding qualified workers could be difficult [13,78]. A similar situation has also been reported in other countries, such as in Europe [63,64,65] and New Zealand [4,29].
Since the early 1970s, employment in the logging industry in the U.S. has been steadily declining, while the production level has increased significantly, mainly due to technological advancements. As a result, the overall productivity of the logging industry has increased. There are significant differences in the logging industry productivity among different regions and states. Georgia and South Carolina have the highest logging labor productivity. Rising productivity levels in the southern U.S. have been described by Conrad IV et al. [26]. High productivity in the South is largely the result of the mechanized harvest system and its compatibility with planted pine forests. Mechanized logging operations accounted for more than 70% of the logging firms in Georgia since 1987, and it has accounted for more than 80% since 1992 [8]. These studies are consistent with the results of our study. However, an opposite situation has been identified, and the logging employment in Montana, decreased by 44% since 1993, while the production level and revenue decreased more (64% and 71%, respectively), which indicated productivity of the logging industry might decrease [83]. Another study from Alberta, Canada, found that the rate of technical change and total factor productivity growth was negative because of stringent forest management regulations [84].
The prosperity of the logging industry is highly dependent on the economic conditions with an impact on both demand and price. Other studies based on firm-level data have reached similar conclusions: The economic recession that began in 2008 severely affected the business environment in which they operated and their profits were not sufficient to sustain their operations [76,85]. Coupled with the continuous increase in operating costs, these two factors together led to a wave of closures of logging firms. Similar situations were found in Canada [2,73] and Europe [74]. However, it also accelerated the adjustment of the logging industry. With the decline in the number of logging firms, the adjustment of business strategies and the recovery of the economy, the profits of logging firms have risen again.
4. Conclusions
This paper analyzed the logging industry in the U.S. in recent decades from federal- and state-level data, including OES, QWI, QCEW, and TPO. The logging industry has been experiencing reduced employment and the implications of the aging workforce. This might be due to increased productivity from the technological advancement of mechanization and reduced demand for logging. The EIO-LCA model was applied to estimate the profitability of the entire industry at the state level. It was found that the reduced demand and increased operating costs led to poor profitability and a wave of closures of logging firms, but also accelerated adjustment in the logging industry.
These data sets contain many state-level indicators from multiple states over long periods, which can provide valuable information to investigate the facts and trends in the logging industry. The firm-level surveys also have value, such as those from Georgia and South Carolina [26], Michigan [69], Maine [86], and the South [14,27,85]. These surveys can provide important information about the logging industry at the firm level, but those surveys were not conducted every year and suffered from small sample sizes and the associated bias. As a result, the multi-year, industry-level data can better demonstrate changes across the U.S. or regions and serve for comparisons between states and/or regions. The U.S. Bureau of Labor Statistics and the USDA Forest Service should pay attention to the construction of these databases, ensure the completeness and validity of the data, and strive to include data from more states. Then, it would be easier for policy makers and industry practitioners to effectively monitor the entire logging industry.
This paper also presents a feasibility method for estimating the profit for the logging industry. Due to time and budget constraints and a lack of profit statistics at the industry level, it is valuable to estimate profit by the EIO-LCA model, which is simple and cost effective. It can provide information to support the logging business operation and policy making.
Employers may need some assistance in on-the-job or off-the-job training to increase the number of qualified loggers. Skills’ certification and occupational licensing have been used to provide mobility for workers and may help employers easily identify qualified workers. Future research needs to apply econometric modeling to analyze the contemporaneous causal relations among employment, wage, mechanization, production price, and other factors in the logging industry and to investigate the dynamic relationship among employment and other factors in short and long terms.
The logging industry is an important part of the timber supply chain and has an important impact on sustainable forest management. Therefore, logging firms with high production efficiency will determine the future of forestry in the U.S. [6,87]. Future research is needed to measure the capital productivity and total factor productivity of logging firms at the industry level and study the influencing factors. With the outbreak of COVID-19, the U.S. economy fell into a recession again. Subsequently, the federal government launched multiple rounds of economic stimulus policies, which not only stimulated the economic recovery but also promoted the prosperity of the real estate market. Future research can focus on the impact of COVID-19 as a natural experiment to study the consequences of the economic cycle on the logging industry or the impact of the real estate market on the logging industry.
Author Contributions
Conceptualization, M.H. and M.S.; methodology, M.H.; software, M.H.; validation, M.H. and W.L.; formal analysis: M.H., M.S. and W.L.; investigation, M.H.; resources, M.H. and M.S.; data curation, M.H.; writing—original draft preparation, M.H.; writing—review and editing, M.H., M.S., W.L. and Y.Z.; visualization, M.H.; supervision, Y.Z.; project administration, Y.Z.; funding acquisition, M.S. All authors have read and agreed to the published version of the manuscript.
Funding
This research was funded by USDA Forest Service, grant number 18-JV-11330132-069 and The USDA McIntire–Stennis Program.
Data Availability Statement
Data are already in published manuscripts or can be obtained upon request.
Acknowledgments
We are thankful for the financial support from USDA Forest service.
Conflicts of Interest
The authors declare no conflict of interest.
References
- Häggström, C.; Kawasaki, A.; Lidestav, G. Profiles of forestry contractors and development of the forestry-contracting sector in Sweden. Scand. J. For. Res. 2013, 28, 395–404. [Google Scholar] [CrossRef]
- Dodson, E.; Hayes, S.; Meek, J.; Keyes, C.R. Montana logging machine rates. Int. J. For. Eng. 2015, 26, 85–95. [Google Scholar] [CrossRef]
- Spinelli, R.; Magagnotti, N.; Facchinetti, D. Logging companies in the European mountains: An example from the Italian Alps. Int. J. For. Eng. 2013, 24, 109–120. [Google Scholar] [CrossRef]
- Kirk, P.M.; Byers, J.S.; Parker, R.J.; Sullman, M.J. Mechanisation developments within the New Zealand forest industry: The human factors. J. For. Eng. 1997, 8, 75–80. [Google Scholar]
- Erlandsson, E. The Impact of Industrial Context on Procurement, Management and Development of Harvesting Services: A Comparison of Two Swedish Forest Owners Associations. Forests 2013, 4, 1171–1198. [Google Scholar] [CrossRef]
- Conrad, I.V.J.L.; Greene, W.D.; Hiesl, P. A Review of Changes in US Logging Businesses 1980s–Present. J. For. 2018, 116, 291–303. [Google Scholar] [CrossRef]
- Rummer, R.B. Labor for Forestry Operations? Issues for the 1990s. Trans. ASAE 1994, 37, 639–645. [Google Scholar] [CrossRef]
- Baker, S.A.; Greene, W.D. Changes in Georgia’s logging workforce, 1987–2007. South. J. Appl. For. 2008, 32, 60–68. [Google Scholar] [CrossRef] [Green Version]
- Grushecky, S.T.; McGill, D.W.; Anderson, R.B. Inventory of Wood Residues in Southern West Virginia. North. J. Appl. For. 2006, 23, 47–52. [Google Scholar] [CrossRef] [Green Version]
- Broussard Allred, S. Logging firm succession and retention. For. Prod. J. 2009, 59, 31–36. [Google Scholar]
- Bolding, M.C.; Barrett, S.M.; Munsell, J.F.; Groover, M.C. Characteristics of Virginia’s logging businesses in a changing timber market. For. Prod. J. 2010, 60, 86–93. [Google Scholar] [CrossRef]
- Egan, A. Characteristics of and Challenges Faced by Logging Business Owners in Southern New England. North. J. Appl. For. 2011, 28, 180–185. [Google Scholar] [CrossRef] [Green Version]
- Leon, B.H.; Benjamin, J.G. A Survey of Business Attributes, Harvest Capacity and Equipment Infrastructure of Logging Businesses in the Northern Forest; School of Forest Resources, University of Maine: Orono, ME, USA, 2012. [Google Scholar]
- Greene, W.D.; Marchman, S.C.; Baker, S.A. Changes in logging firm demographics and logging capacity in the US South. In Proceedings of the 36th Annual Council on Forest Engineering Meeting, Missoula, MT, USA, 7–10 July 2013; p. 7. [Google Scholar]
- LeBel, L.G.; Stuart, W.B. Technical Efficiency Evaluation of Logging Contractors Using a Nonparametric Model. J. For. Eng. 1998, 9, 15–24. [Google Scholar]
- Allen, T.T.; Han, H.; Shook, S.R. A structural assessment of the contract logging sector in the Inland Northwest. For. Prod. J. 2008, 58, 27. [Google Scholar]
- Butler, B.J. Family Forest Owners of the United States, 2006; Gen. Tech. Rep. NRS-27; US Department of Agriculture, Forest Service, Northern Research Station: Newtown Square, PA, USA, 2008; p. 72. [Google Scholar]
- Grice, A.; Peer, J.M.; Morris, G.T. (Eds.) Today’s aging workforce—Who will fill their shoes? In Proceedings of the 64th Annual Conference for Protective Relay Engineers; IEEE, College Station, TX, USA, 11–14 April 2011. [Google Scholar]
- Schwatka, N.V.; Butler, L.M.; Rosecrance, J.R. An Aging Workforce and Injury in the Construction Industry. Epidemiologic Rev. 2011, 34, 156–167. [Google Scholar] [CrossRef] [PubMed] [Green Version]
- Dorr, B.M.; Feuerhelm, S.L. Addressing the silver tsunami in the accounting industry. J. Work. Manag. 2021, 13, 142–153. [Google Scholar] [CrossRef]
- Eriksson, M.; Lebel, L.; Lindroos, O. The Effect of Customer–Contractor Alignment in Forest Harvesting Services on Contractor Profitability and the Risk for Relationship Breakdown. Forests 2017, 8, 360. [Google Scholar] [CrossRef] [Green Version]
- Mac Donagh, P.; Velazco, S.J.E.; Botta, G.F.; Schlichter, T.; Cubbage, F. Logging Contractors’ Growth in the Southern Cone: An Analysis of Contractor Business Strategies, Innovation, and Mechanization. Forests 2019, 10, 69. [Google Scholar] [CrossRef] [Green Version]
- Hultaker, O.; Bohlin, F. Developing the business: Logging contractors’ strategic choices for profitability and work environment. In Scandinavian Forest Economics, Proceedings of the Biennial Meeting of the Scandinavian Society of Forest Economics, Vallvägen, Sweden, 2004; 2004; pp. 13–22. Available online: http://www.metla.fi/tapahtumat/2004/ssfe/presentations/wg1/ssfe-Hultaker_Bohlin-2004.pdf (accessed on 20 December 2020).
- Demir, M. Investigation of timber harvesting mechanization progress in Turkey. Afr. J. Biotechnol. 2010, 9, 1628–1634. [Google Scholar] [CrossRef] [Green Version]
- Rickenbach, M.; Steele, T.W. Comparing mechanized and non-mechanized logging firms in Wisconsin: Implications for a dynamic ownership and policy environment. For. Prod. J. 2005, 55, 21. [Google Scholar]
- Conrad, J.L., IV; Greene, W.D.; Hiesl, P. The evolution of logging businesses in Georgia 1987–2017 and South Carolina 2012–2017. For. Sci. 2018, 64, 671–681. [Google Scholar] [CrossRef]
- Abt, K.L. Employment and income trends and projections for forest-based sectors in the US. In The Southern Forest Futures Project: Technical Report; Gen. Tech. Rep. SRS-GTR-178; USDA-Forest Service; Wear, D.N., Greis, J.G., Eds.; Southern Research Station: Asheville, NC, USA, 2013; Volume 178, pp. 293–308. [Google Scholar]
- Egan, A.; Taggart, D. Public Perceptions of the Logging Profession in Maine and Implications for Logger Recruitment. North. J. Appl. For. 2009, 26, 93–98. [Google Scholar] [CrossRef] [Green Version]
- Bayne, K.M.; Parker, R.J. The introduction of robotics for New Zealand forestry operations: Forest sector employee perceptions and implications. Technol. Soc. 2012, 34, 138–148. [Google Scholar] [CrossRef]
- Penttinen, M.J.; Mikkola, J.; Rummukainen, A. Profitability of Wood Harvesting Enterprises; Working Papers of the Finnish Forest Research Institute; Finnish Forest Research Institute: Helsinki, Finland, 2009; Volume 126. [Google Scholar]
- Soirinsuo, J.; Mäkinen, P. Importance of the financial situation for the growth of a forest machine entrepreneur. Scand. J. For. Res. 2009, 24, 264–272. [Google Scholar] [CrossRef]
- Baker, S.; Dodson, B.; Greene, D.; Hayes, S. (Eds.) Evaluation of an Online National Survey of Timber Harvesting Contractors. In Proceedings of the 37th Council on Forest Engineering Annual Meeting, Moline, IL, USA, 22–25 June 2014. [Google Scholar]
- Blinn, C.R.; O’Hara, T.J.; Chura, D.T.; Russell, M.B. Minnesota’s Logging Businesses: An Assessment of the Health and Viability of the Sector. For. Sci. 2015, 61, 381–387. [Google Scholar] [CrossRef] [Green Version]
- Milauskas, S.J.; Wang, J. West Virginia logger characteristics. For. Prod. J. 2006, 56, 19. [Google Scholar]
- Office of Management and Budget. The North American Industry Classification System (NAICS) Revision for 2017. Available online: https://www.census.gov/naics/reference_files_tools/2017_NAICS_Manual.pdf (accessed on 12 November 2021).
- Bureau of Labor Statistics. OES Data Overview. Available online: https://www.bls.gov/oes/oes_ques.htm# (accessed on 20 January 2021).
- Bureau of Labor Statistics, U.S. Department of Labor. Occupational Employment Statistics. Available online: www.bls.gov/oes/ (accessed on 26 December 2020).
- U.S. Census Bureau. Quarterly Workforce Indicators. 2019. Available online: https://qwiexplorer.ces.census.gov/static/explore.html#x=0&g=0 (accessed on 19 September 2020).
- Bureau of Labor Statistics. Handbook of Methods: Quarterly Census of Employment and Wages. Available online: https://www.bls.gov/opub/hom/cew/home.htm (accessed on 20 January 2021).
- Bureau of Labor Statistics. Quarterly Census of Employment and Wages: One-Screen Data Search. Available online: https://data.bls.gov/PDQWeb/en (accessed on 15 December 2020).
- Bureau of Labor Statistics. Quarterly Census of Employment and Wages. Available online: https://www.bls.gov/cew/ (accessed on 23 December 2020).
- U.S. Department of Agriculture, Forest Service. Timber Products Output Studies. Available online: https://www.fia.fs.fed.us/program-features/tpo/ (accessed on 20 January 2021).
- U.S. Department of Agriculture, Forest Service. Timber Product Output (TPO) Reports, Knoxville, TN, 2019. Available online: http://srsfia2.fs.fed.us/php/tpo_2009/tpo_rpa_int1.php (accessed on 19 September 2020).
- Bureau of Labor Statistics. Producer Price Index by NAICS Industry. Available online: https://data.bls.gov/PDQWeb/pc (accessed on 20 December 2020).
- Harrison, P.; Sharpe, A. A Detailed Analysis of the Productivity Performance of the Canadian Forest Products Sector Since 2000, Ottawa. 2009. Available online: http://citeseerx.ist.psu.edu/viewdoc/download?doi=10.1.1.660.1782&rep=rep1&type=pdf (accessed on 1 September 2020).
- Moulton, B.R. The Measurement of Output, Prices, and Productivity: What’s Changed Since the Boskin Commission? Available online: https://www.brookings.edu/research/the-measurement-of-output-prices-and-productivity (accessed on 23 December 2020).
- Leontief, W. Input-Output Economics; Oxford University Press: Oxford, UK, 1986; ISBN 0195365224. [Google Scholar]
- Norman, J.; Charpentier, A.D.; MacLean, H.L. Economic Input−Output Life-Cycle Assessment of Trade between Canada and the United States. Environ. Sci. Technol. 2007, 41, 1523–1532. [Google Scholar] [CrossRef] [Green Version]
- Carnegie Mellon University. Theory and Method behind EIO-LCA. Available online: http://www.eiolca.net/Method/eio-lca-method.html (accessed on 6 January 2021).
- Khongprom, P.; Champanoi, S.; Suwanmanee, U. An Input-Output Approach for Environmental Life Cycle: Assessment of Cement Production. Chem. End. Trans. 2020, 81, 1345–1350. [Google Scholar]
- Carnegie Mellon University. Economic Results: Value Added Effects in Monetary Units. Available online: http://www.eiolca.net/Method/interp-results/econ_direct_percent.html (accessed on 6 January 2021).
- Goldstein, J.P.; Irland, L.C.; Senick, J.A.; Bassett, E.W. The Intergenerational Supply of Loggers under Conditions of Declining Economic Well-Being. Ind. Relations: A J. Econ. Soc. 2005, 44, 331–340. [Google Scholar] [CrossRef]
- Shivan, G.C.; Potter-Witter, K.; Blinn, C.R.; Rickenbach, M. The Logging Sector in the Lake States of Michigan, Minnesota, and Wisconsin: Status, Issues, and Opportunities. J. For. 2020, 118, 501–514. [Google Scholar] [CrossRef]
- Bureau of Labor Statistics. Occupational Outlook Handbook: Logging Workers. Available online: https://www.bls.gov/ooh/farming-fishing-and-forestry/logging-workers.htm (accessed on 8 December 2020).
- Egan, A. “The best workers they had”–le bûcheron québécois in Maine’s north woods. For. Chron. 2014, 90, 306–309. [Google Scholar] [CrossRef] [Green Version]
- O’Neal, B.; Shaffer, B. Hispanic Logging Worker Safety in the South; Technical Release 06-R-17; Forest Resources Association: Rockville, MD, USA, 2006; p. 2. [Google Scholar]
- O’Neal, B.S. Safety Training for Spanish-Speaking Workers in the Logging Industry in the Southeastern United States. Ph.D. Thesis, Virginia Tech, Blacksburg, VA, USA, 2006. [Google Scholar]
- Bruno, A. Immigration: Policy Considerations Related to Guest Worker Programs. Available online: https://www.everycrsreport.com/reports/RL32044.html (accessed on 29 November 2021).
- Brodbeck IV, A.M. Immigrant Labor in the Forest Industry: The Impacts of H-2B Employment on Local Livelihoods. Ph.D. Thesis, Auburn University, Auburn, AL, USA, 2016. [Google Scholar]
- Moseley, C.; Reyes, Y. Comparing job quality in logging and forestry services in Oregon. J. For. 2007, 105, 293–300. [Google Scholar]
- Bureau of Labor Statistics. Occupational Employment and Wages: 45-4021 Fallers. Available online: https://www.bls.gov/oes/current/oes454021.htm#st (accessed on 17 March 2020).
- Wilson, J. The Job No One Wants: Why Won’t young People Work in Logging? Available online: https://www.theguardian.com/us-news/2017/aug/23/logging-industry-work-employment-oregon (accessed on 12 May 2021).
- Jodłowski, K.; Kalinowski, M. Current possibilities of mechanized logging in mountain areas. For. Res. Pap. 2018, 79, 365–375. [Google Scholar] [CrossRef] [Green Version]
- Duduman, G.; Bouriaud, L. Managing innovations in wood harvesting and primary processing firms–case study of Suceava. For. Stud. 2007, 46, 89–101. [Google Scholar]
- Błuszkowska, U.; Nurek, T. Effect of mechanization level on manpower needs in forestry. Folia For. Pol. 2014, 56, 194–201. [Google Scholar] [CrossRef] [Green Version]
- Penttinen, M.; Rummukainen, A.; Mikkola, J. Profitability, Liquidity and Solvency of Wood Harvesting Contractors in Finland. Small-Scale For. 2010, 10, 211–229. [Google Scholar] [CrossRef]
- Carson, W.W. Is New Zealand ready for steep country logging? New Zealand J. For. 1983, 28, 24–34. [Google Scholar]
- Drapala, P. Decline in Housing Market Hits Forestry Industry Hard. Mississippi Agricultural News [Online]. 17 December 2009. Available online: https://extension.msstate.edu/news/feature-story/2009/decline-housing-market-hits-forestry-industry-hard?page=2 (accessed on 21 October 2021).
- Abbas, D.; Handler, R.; Hartsough, B.; Dykstra, D.; Lautala, P.; Hembroff, L. A survey analysis of forest harvesting and transportation operations in Michigan. Croat. J. For. Eng. J. Theory Appl. For. Eng. 2014, 35, 179–192. [Google Scholar]
- Rummukainen, A.; Brogt, T.; Kastenholz, E. Challenges for Forestry Contractors: Various Structures but Mutual Problems in Finland, Germany, Poland and Romania. In Issues Affecting Enterprise Development in the Forest Sector in Europe; Research Notes 169; Niskanen, A., Ed.; University of Joensuu, Faculty of Forestry: Joensuu, Finland, 2006; pp. 149–174. [Google Scholar]
- Carnegie Mellon University. Economic Input-Output Life Cycle Assessment Model. Available online: http://www.eiolca.net (accessed on 1 November 2020).
- Federal Reserve. Federal Reserve Economic Data: New Privately-Owned Housing Units Started. Available online: Fred.stlouisfed.org/series/HOUST# (accessed on 29 September 2021).
- Cubbage, F.W.; Stokes, B.J.; Granskog, J.E. Trends in southern forest harvesting equipment and logging costs. For. Prod. J. 1988, 32, 6–10. [Google Scholar]
- Spinelli, R.; Magagnotti, N.; Jessup, E.; Soucy, M. Perspectives and challenges of logging enterprises in the Italian Alps. For. Policy Econ. 2017, 80, 44–51. [Google Scholar] [CrossRef]
- Timber Update. All Timber Prices. Available online: https://timberupdate.com/timber-prices/ (accessed on 15 November 2020).
- Jacobson, M.; Finley, J.; Schmid, C. Factors and Trends in Pennsylvania’s Logging Industry; Hardwoods Development Council: Duncannon, PA, USA, 2009. [Google Scholar]
- Barynin, P.; Taylor, D.; Ghouri, W.; Warth, C. Wood Supply Chain Analysis: Special Market Analysis Study; RISI: Boston, MA, USA, 2013; p. 27. [Google Scholar]
- Xu, Y.; Smidt, M.; Zhang, Y. Logging worker wage, performance, and experience. For. Prod. J. 2014, 64, 210–216. [Google Scholar] [CrossRef]
- Bureau of Labor Statistics. National Industry-Specific Occupational Employment and Wage Estimates: NAICS 113300—Logging. Available online: https://www.bls.gov/oes/2019/may/naics4_113300.htm (accessed on 1 September 2020).
- Costello, B.; Suarez, R. Truck Driver Shortage Analysis 2015; The American Trucking Associations: Arlington, VA, USA, 2015. [Google Scholar]
- Egan, A.; Taggart, D. Who will log? Occupational choice and prestige in New England’s north woods. J. For. 2004, 102, 20–25. [Google Scholar]
- Regula, J.; Germain, R.; Bick, S.; Zhang, L. Assessing the Economic Viability of Loggers Operating Tree-Length Harvest Systems in the Northeast. J. For. 2018, 116, 347–356. [Google Scholar] [CrossRef] [Green Version]
- Morgan, T.A.; Keegan, C.E.; Hayes, S.W.; Sorenson, C.B. Montana’s Forest Products Industry: 2013 Outlook. Available online: https://www.bber.umt.edu/pubs/forest/Outlook/forestproducts2015.pdf (accessed on 14 November 2021).
- Wang, S.; An, H. Technical change and productivity growth in the Alberta logging industry. For. Policy Econ. 2019, 102, 130–137. [Google Scholar] [CrossRef]
- Baker, S.; Greene, D.; Harris, T. Impact of Timber Sale Characteristics on Harvesting Costs. In Proceeding of the Southern Forest Economics Workshop, Charlotte, NC, USA, 15–17 March 2012. [Google Scholar]
- Taggart, D.; Egan, A. Logging across Borders and Cultures: An Example in Northern Maine. For. Prod. J. 2011, 61, 561–569. [Google Scholar] [CrossRef]
- Duc, N.M.; Shen, Y.; Zhang, Y.; Smidt, M. Logging productivity and production function in Alabama, 1995 to 2000. For. Prod. J. 2009, 59, 22–26. [Google Scholar]
Figure 1.
Average monthly earnings of newly stable employees in the logging industry and all industries, U.S., during 1997 to 2019 [38].
Figure 1.
Average monthly earnings of newly stable employees in the logging industry and all industries, U.S., during 1997 to 2019 [38].

Figure 2.
Age distribution of employees in the logging industry, U.S., 1997, 2007, and 2017 [38].
Figure 2.
Age distribution of employees in the logging industry, U.S., 1997, 2007, and 2017 [38].

Figure 3.
Inflation-adjusted (a) net profits of the logging industry at state level and (b) net profits per logging firm in some states from 1995 to 2015, based on the EIO-LCA models (2019 Constant-dollar) [38,71]. Notes: AL, MS, GA, NC, SC, LA, TX, TN, VA, and FL signify Alabama, Mississippi, Georgia, North Carolina, South Carolina, Louisiana, Texas, Tennessee, Virginia, and Florida, respectively.

Figure 4.
Inflation-adjusted profit per firm and annual, new, privately owned housing units started (2019 Constant-dollar), 2001 to 2015 [38,72].

Figure 5.
Logging industry (a) production level and (b) estimated revenue in some states, 1999 to 2015 [37,43,75]. Notes: AL, FL, GA, LA, MS, NC, SC, TN, TX, and VA signify Alabama, Florida, Georgia, Louisiana, Mississippi, North Carolina, South Carolina, Tennessee, Texas, and Virginia, respectively.


Figure 6.
Annual Producer Price Index of logging (Index Dec 1981 = 100), U.S., 2001 to 2019 [38]. Notes: PPI signifies Producer Price Index.
Figure 6.
Annual Producer Price Index of logging (Index Dec 1981 = 100), U.S., 2001 to 2019 [38]. Notes: PPI signifies Producer Price Index.

Figure 7.
Inflation-adjusted profit per firm (a) annual wage and (b) capital stock per ton production (2019 Constant-dollar), 2001 to 2015 [38,77].

Figure 8.
Inflation-adjusted payroll per logging firms (2019 Constant-dollar) in some states, 2001 to 2019 [38,41]. Notes: GA, ME, NY, MI, TX, and OR signify Georgia, Maine, New York, Michigan, Texas, and Oregon, respectively.


Table 1.
Annual growth of employment in the logging industry from 1997 to 2017 [38].
Table 1.
Annual growth of employment in the logging industry from 1997 to 2017 [38].
| Region | Total Employment, 1997 * | Total Employment, 2017 | Total Growth of Employment (%) | Annual Growth of Employment (%) |
|---|---|---|---|---|
| New England | 3283 | 2750 | −16.2 | −0.9 |
| Mid-Atlantic | 2284 | 1327 | −41.9 | −2.7 |
| The South | 36,761 | 25,575 | −30.4 | −1.8 |
| The Southwest | 3154 | 1430 | −54.7 | −3.9 |
| Midwest | 5206 | 4176 | −19.8 | −1.1 |
| The West | 20,853 | 12,553 | −39.8 | −2.5 |
* For states that had no employment data for 1997, the closest available year was used.
| Region | State | Report Year | Volume of Output | Value of Output | Hours Worked | Labor Productivity (Volume) | Labor Productivity (Value) |
|---|---|---|---|---|---|---|---|
| The South | Alabama | 1997–2015 | −1.5 | −1.3 | −2.3 | 0.8 | 1.0 |
| Arkansas | 1997–2015 | −1.4 | −1.2 | −4.6 | 3.4 | 3.6 | |
| Florida | 1997–2015 | 0.3 | 0.5 | −1.5 | 1.8 | 2.1 | |
| Georgia | 1997–2015 | −0.1 | 0.2 | −2.2 | 2.1 | 2.4 | |
| Kentucky | 1997–2015 | −0.3 | 0.0 | −2.4 | 2.1 | 2.4 | |
| Louisiana | 1997–2015 | −0.3 | 0.0 | −2.0 | 1.8 | 2.0 | |
| Mississippi | 1997–2015 | −1.3 | −1.1 | −2.5 | 1.2 | 1.5 | |
| N. Carolina | 1997–2015 | −1.7 | −1.4 | −1.7 | 0.1 | 0.3 | |
| S. Carolina | 1997–2015 | 0.8 | 1.0 | −0.7 | 1.4 | 1.7 | |
| Tennessee | 1997–2015 | −2.5 | −2.2 | −0.9 | −1.6 | −1.3 | |
| Virginia | 1997–2015 | 0.0 | 0.3 | −0.3 | 0.3 | 0.6 | |
| The Southwest | Oklahoma | 1997–2015 | −1.4 | −1.1 | −5.1 | 4.0 | 4.2 |
| Texas | 1997–2013 | −2.5 | −2.2 | −3.2 | 0.8 | 1.1 | |
| The West | California | 2000–2016 | −1.8 | −1.1 | −4.7 | 3.0 | 3.7 |
| Colorado | 2002–2016 | 4.5 | 5.8 | 3.7 | 0.7 | 2.0 | |
| Idaho | 2001–2015 | 0.9 | 2.2 | −2.4 | 3.3 | 4.7 | |
| Oregon | 2003–2017 | 0.1 | 1.3 | 3.0 | −2.8 | −1.6 | |
| Washington | 2002–2016 | −1.6 | −0.3 | −1.7 | 0.1 | 1.5 | |
| Wyoming | 2000–2018 | 3.7 | 4.6 | −3.2 | 7.2 | 8.1 | |
| Average | −0.3 | 0.2 | −1.8 | 1.6 | 2.1 |
Publisher’s Note: MDPI stays neutral with regard to jurisdictional claims in published maps and institutional affiliations. |
© 2021 by the authors. Licensee MDPI, Basel, Switzerland. This article is an open access article distributed under the terms and conditions of the Creative Commons Attribution (CC BY) license (https://creativecommons.org/licenses/by/4.0/).
Share and Cite
MDPI and ACS Style
He, M.; Smidt, M.; Li, W.; Zhang, Y. Logging Industry in the United States: Employment and Profitability. Forests 2021, 12, 1720. https://doi.org/10.3390/f12121720
AMA Style
He M, Smidt M, Li W, Zhang Y. Logging Industry in the United States: Employment and Profitability. Forests. 2021; 12(12):1720. https://doi.org/10.3390/f12121720
Chicago/Turabian StyleHe, Mingtao, Mathew Smidt, Wenying Li, and Yaoqi Zhang. 2021. "Logging Industry in the United States: Employment and Profitability" Forests 12, no. 12: 1720. https://doi.org/10.3390/f12121720
Note that from the first issue of 2016, this journal uses article numbers instead of page numbers. See further details here.