
Pilot-Scale H2S and Swine Odor Removal System Using Commercially Available Biochar
by
 , , , and
Kyoung S. Ro
1,* ,
,
Bryan Woodbury
2, 
Mindy Spiehs
2,
Ariel A. Szogi
1 ,
,
Philip J. Silva
3,
Okhwa Hwang
4 and
Sungback Cho
5 1
Coastal Plains Soil, Water & Plant Research Center, United States Department of Agriculture (USDA) Agricultural Research Service (ARS), 2611 W. Lucas St., Florence, SC 29501, USA
2
Meat Animal Research Center, United States Department of Agriculture (USDA) Agricultural Research Service (ARS), 844 Road 313, Clay Center, NE 68933, USA
3
Food Animal Environmental Systems Research Unit, United States Department of Agriculture (USDA) Agricultural Research Service (ARS), 2413 Nashville Road B5, Bowling Green, KY 42101, USA
4
National Institute of Animal Science, Rural Development Administration, Wanju-gun 55365, Korea
5
Institute of Livestock Odor Control, Wanju-gun 55367, Korea
*
Author to whom correspondence should be addressed.
Agronomy 2021, 11(8), 1611; https://doi.org/10.3390/agronomy11081611
Submission received: 30 June 2021
/
Revised: 5 August 2021
/
Accepted: 10 August 2021
/
Published: 13 August 2021
(This article belongs to the Special Issue Recycling Agricultural, Industrial, and Municipal Byproducts While Enhancing Agricultural Production and Protecting the Environment – Volume I)
Abstract
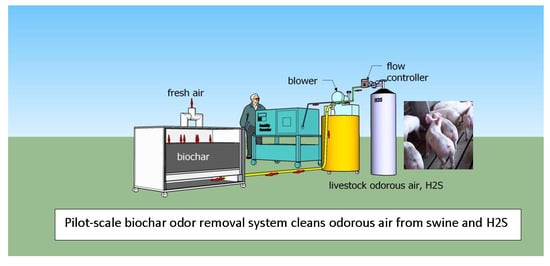
:Although biochars made in laboratory seem to remove H2S and odorous compounds effectively, very few studies are available for commercial biochars. This study evaluated the efficacy of a commercial biochar (CBC) for removing H2S and odorous volatile organic compounds (VOCs). We found that the well-known Ergun equation may not be adequate in predicting pressure drop for properly sizing a ventilation system. The H2S breakthrough adsorption capacity of the CBC was 2.51 mg/g under humid conditions, which was much higher than that for dry conditions. The breakthrough capacity increased with the influent concentration of H2S. The efficacy of a pilot-scale biochar odor removal system (PSBORS) for removing 15 odorous VOCs was evaluated by placing it in a swine gestation stall continually treating the inside air for 21 days. All VOCs in the PSBORS effluent were below detection limit except for acetic acid. However, due to the very high odor threshold of acetic acid, its contribution to the odor would be minimal. It appeared that the CBC could be used to reduce both H2S and odorous VOCs with the potential of recycling the spent CBC for soil health improvement after using it for H2S and odor removal.
1. Introduction
The removal of trace malodorous compounds from the air inside livestock buildings and ventilation streams is increasingly essential because of the rise in civil complaints and concerns for animal and human health [1,2,3,4,5]. Odor emissions from livestock operations disrupt the quality of life in rural and suburban communities [6,7]. Among the malodorous compounds, hydrogen sulfide (H2S) is a toxic gas causing both acute and chronic health problems depending on the exposure time and concentration [5]. Many other malodorous volatile and semi-volatile organic compounds from animal feeding operations have been identified in the literature [8,9,10,11,12,13]. Maurer et al. reported a comprehensive list of various technologies available to reduce odor emissions and their effectiveness [14]. Others also suggested the use of biochar to reduce odor emission [15,16].
Biochar is a carbonaceous product of pyrolyzing biomass with the potential to improve soil quality and water holding capacities [17]. Recently, Hwang et al. evaluated the potential of using biochar made from animal manure and plant biomass for removing 15 odorous volatile organic compounds (VOCs) which consisted of reduced sulfur compounds, volatile fatty acids, phenolic, and indolic compounds [18]. They found that manure-based biochars could not effectively remove reduced sulfur compounds such as dimethyl disulfide (DMDS) and dimethyl trisulfide (DMTS). In contrast, plant biomass-based biochars were effective in removing DMDS and DMTS. In addition, Ro et al. reported that non-activated biochar made from wood shavings and chicken litter showed similar sorption capacities toward ammonia, another malodorous gas emitted from animal feeding operations [19].
While fresh biochar can remove H2S, NH3, and other odorous VOCs, the spent biochar may also have the potential to be used as a soil amendment, provided adsorbed odorous compounds do not have adverse effect on soil health and the environment. In addition, the spent biochar loaded with S compounds could provide S to soil, an essential macronutrients for plants [20]. Unfortunately, soil application of spent biochar with adsorbed odorous compounds and the associated economics have not been studied to date.
Although biochars appear to be effective in directly removing odorous compounds from the air via sorption, most biochars used in the literature were produced in small quantities using laboratory-scale pyrolysis systems with well-defined process conditions. It is largely unknown whether the biochars used in these laboratory systems can be scaled up and produced in large quantities with consistent biochar quality for the implementation of this technology in the field. Except for the studies using biochar diet supplementation [21,22], there is no systematic study reported in the literature on directly removing odorous compounds in the air using commercially produced biochars. There is a need for evaluating commercially available biochar for its effectiveness in reducing odor in field- or in pilot-scales.
The objective of this study was to evaluate the efficacy of a commercially available biochar (CBC) as an adsorption filter medium for H2S and odorous compounds. We determined the physicochemical properties, pressure drop, and adsorption capacities of the commercial biochar using both bench-scale sorption column and pilot-scale odor removal systems.
2. Materials and Methods
2.1. Biochar and Its Physico-Chemical Characteristics
The CBC was made from pyrolyzing pine biomass at a temperature between 500 to 600 °C for 10 h (medium size biochar, Biochar Now, Loveland, CO, USA). According to the company’s website [23], the particle sizes of the medium size biochar ranged from 3 mm to 26 mm mesh size. The biochar particle dimensions were measured using a flatbed scanner (600 dpi, Epson Perfection V500, Long Beach, CA, USA) and a public domain image processing computer program Health (ImageJ, National Institute of Health), as described by Pordesimo et al. [24]. The N2 BET (Brunauer–Emmett–Teller) surface area of the biochar was measured via N2 adsorption multilayer theory using a Nova 2200e surface area analyzer (Quantachrome Instrument Corp, Boynton Beach, FL, USA). The chemical properties of the biochar were characterized for their pH, proximate, and ultimate properties. The ceiling concentrations for pollutants for all biosolids applied to the land as required by the U.S. Environmental Protection Agency (USEPA) or known as Part 503 elements [25] (As, Cr, Cu, Pb, Mo, Ni, Se, Zn) were also measured. The pH of the biochar was measured by mixing 0.4 g of char and 20 mL of DI water and shaking for 24 h (1:50 ratio). Proximate and ultimate properties (ASTM D3172 and 3176) of triplicate samples of feedstock and biochar were performed by Hazen Research Inc. (Golden, CO, USA). The Part 503 elements were measured on a dried basis by Arizona Laboratory for Emerging Contaminants (ALEC) [26] using the modified USEPA method 3051 and inductively coupled plasma mass spectrometry (ICP-MS).
2.2. Bench-Scale Biochar Column
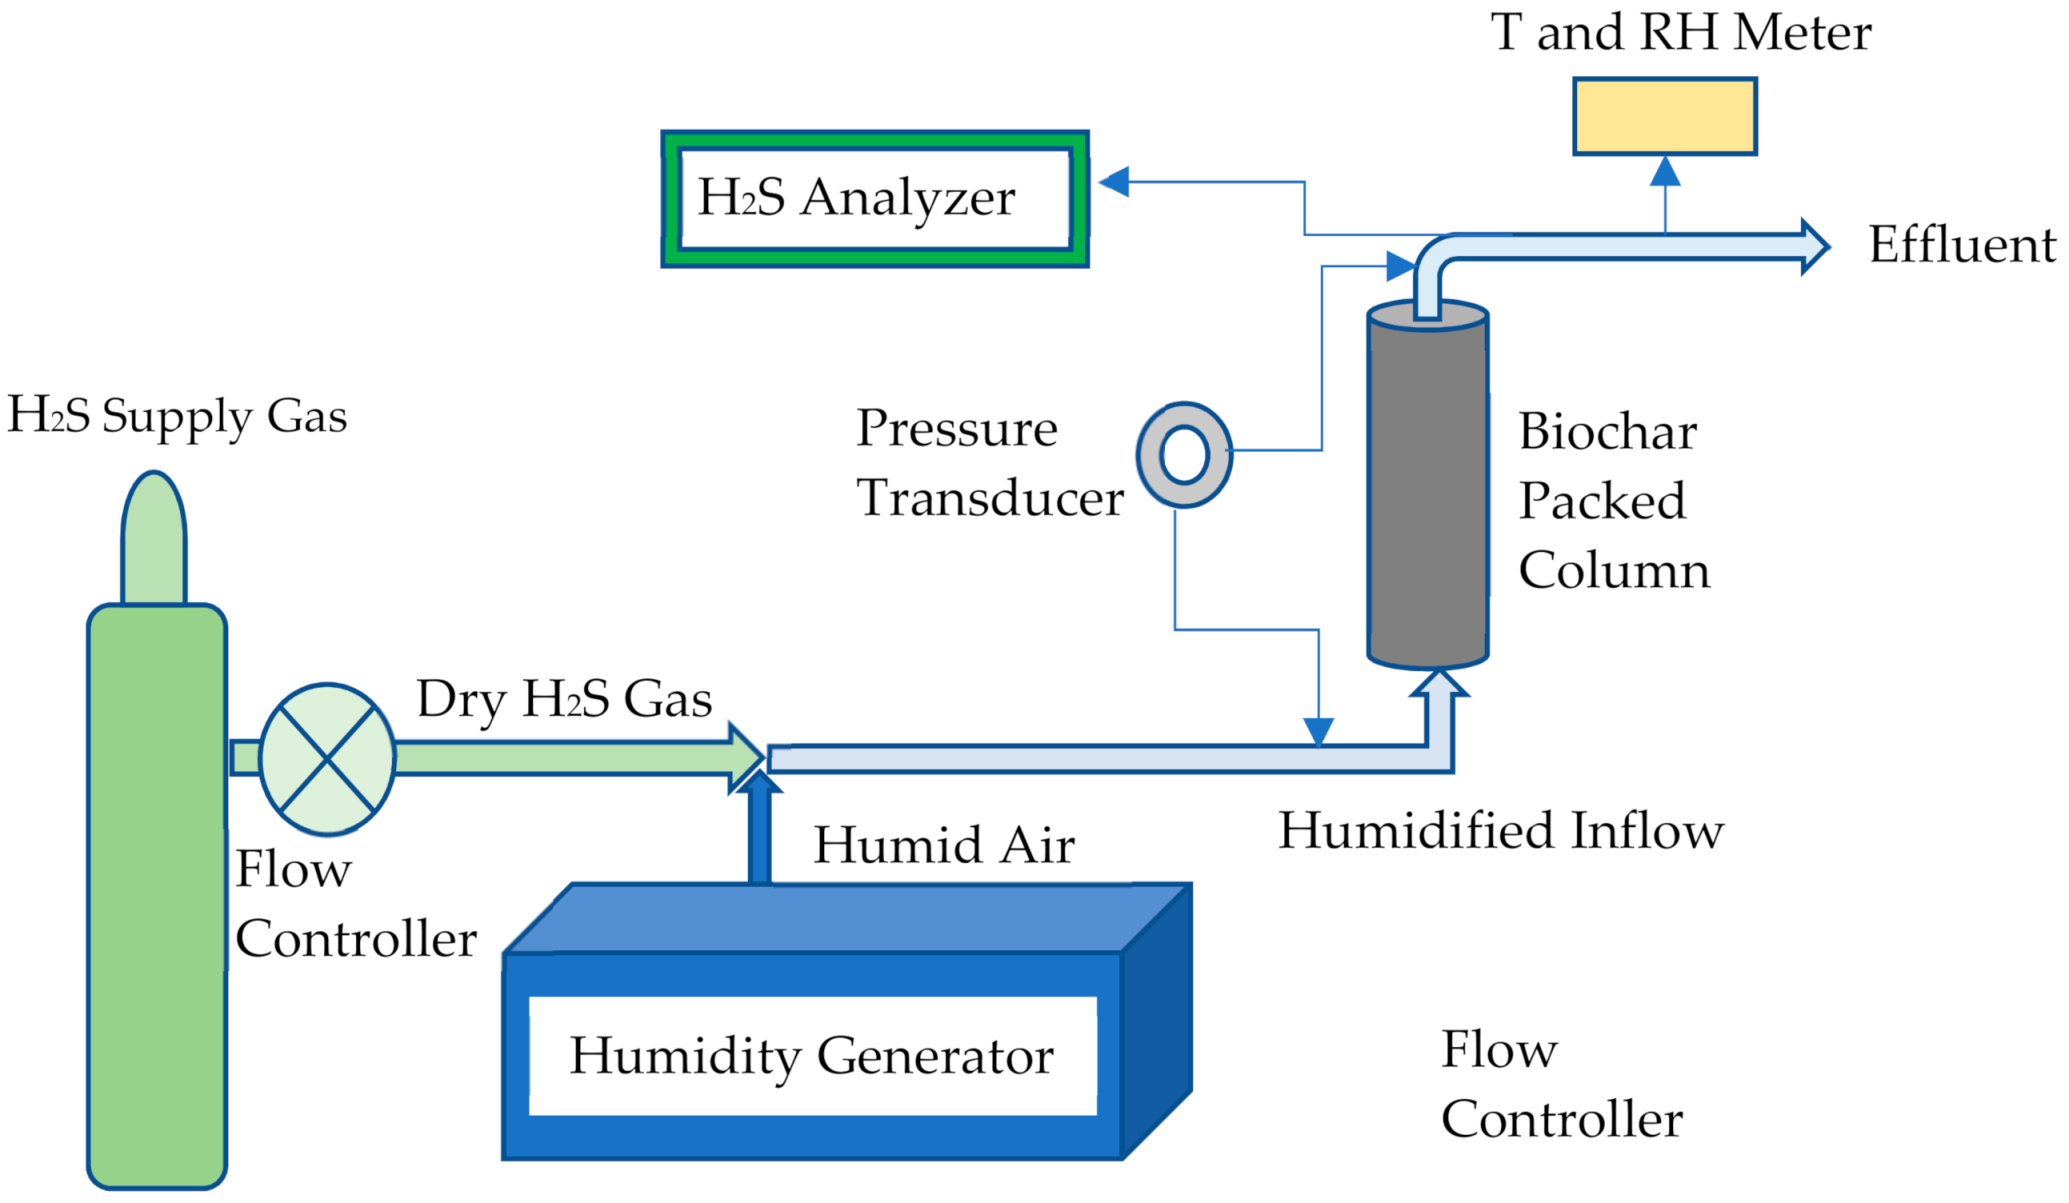
The commercial biochar was evaluated for its H2S adsorption capacity using a bench-scale biochar column (Figure 1) and a standard H2S gas at concentrations of 99.9 and 490 ppm (Praxair, Danbury, CT, USA). The H2S gas was passed through a PVC column (5.08 cm i.d. × 21 cm length) filled with the biochar. The outlet concentration (i.e., breakthrough concentration) was measured to determine the H2S adsorption capacity of the biochar. A coarse screen (3-mm mesh) was placed at the bottom of the column to prevent clogging in the hose fitting. The column was filled with about 30 g of 6-mm glass beads to ensure uniform distribution of the inflow. A fine screen (1-mm mesh) was placed on top of the glass beads. The biochar particles were filled above the glass beads.
The influent consisted of dry H2S gas with a known concentration from a gas cylinder and humid air with a known humidity from a humidity generator (model #2500, Thunder Scientific Corp, Albuquerque, NM, USA). A gas flow controller (SmartTrak #C100L, Sierra Instruments, Monterey, CA, USA) was used to control the flow of the dry H2S gas. The humidity generator was controlled via vendor-provided software, which allowed the selection of humidity, temperature, and flow rate. The dry H2S gas and the humid air were combined via a tee fitting into the single Teflon supply tube connected to the bottom hose fitting on the biochar column. The humid H2S gas mixture passed through the biochar column and out through a section of Teflon tubing. Additional tee fittings were installed in the outlet tubes to provide measurement points for outlet concentration, temperature, and relative humidity. The concentration was measured using an H2S analyzer (Model P102+, PID Analyzers, Sandwich, MA, USA). The temperature and relative humidity were measured with an additional analyzer (model #HH314A, Omega Engineering, Norwalk, CT, USA). The differential pressure was measured across the biochar column using a pressure transducer (model #2651010WD11T1C, Setra, Boxborough, MA, USA). The pressure transducer was operated by a custom LabView code using a tablet PC (Microsoft Surface Pro Windows7), switched power supply (Mouser Electronics, #709-SE100-12, Mansfield, TX, USA), and a USB DAQ Module (Labjack Measurement and Automation, #U3-LV, Lakewood, CO, USA). The inlet concentration was calculated based on the combination of the H2S gas concentration and flow rates. The biochar column was conditioned using humid air before introducing humidified H2S gas. Breakthrough concentrations and other variables were measured over time until the breakthrough concentrations began to plateau near the estimated influent concentration.
The adsorption breakthrough capacity of the biochar was calculated by integrating the area above the breakthrough curve until the breakthrough concentration became 50% of the influent concentration. The 50% breakthrough adsorption capacity per unit mass of biochar was calculated as:
where q is the breakthrough adsorption capacity per unit mass of biochar in (mg/g), is the molecular weight of H2S (34.06 g/mol), is influent H2S concentration (ppmv), p is the atmospheric pressure (atm), Q is volumetric flow rate (L/min), is the breakthrough concentration (ppmv), R is the gas constant (0.08205 L-atm/mol-K), T is the temperature (K), is the mass of biochar (g), and is the time to reach the breakthrough concentration to 50% of the influent concentration (min).
2.3. Pilot-Scale Odor Removal System
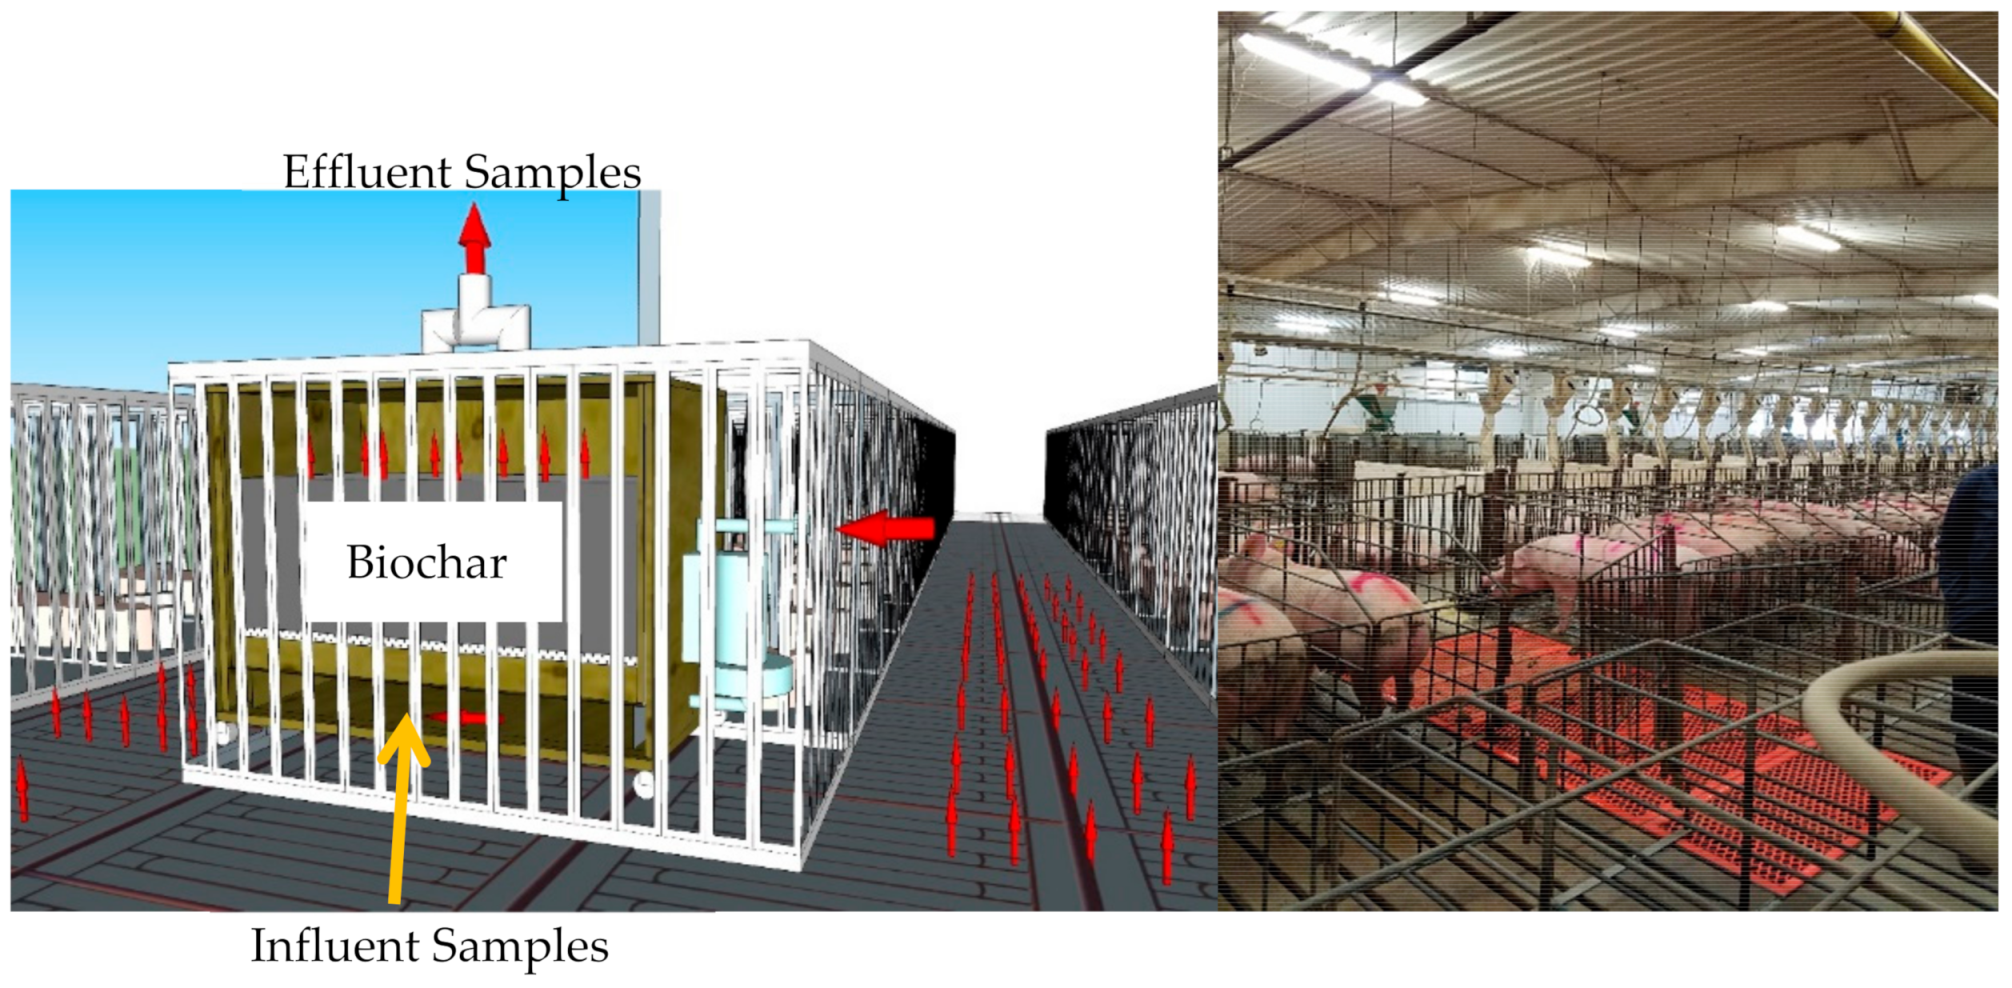
The pilot-scale biochar odor removal system (PSBORS) was placed in a gestation barn. During the study, there were on average 330 sows in the barn at the U.S. Meat Animal Research Center (USMARC), Clay Center, NE. The barn has a pull plug manure system and the manure accumulates under the floor for 30 days. The manure pit has a 0.6-m depth overflow so that there is never more than 0.6 m of liquid manure in the pit at any one time. The PSBORs was sized to fit inside a single gestation stall for the duration of the study. The PSBORS was mounted on swiveling casters to allow maneuvering in the barn (Figure 2). Inside the PSBORS, a cartridge box (1.0 m × 0.5 m × 0.6 m) containing biochar was suspended 6.4 cm above the bottom of the outside unit to allow incoming air to be uniformly distributed before entering the biochar cartridge’s perforated bottom. The bottom of the cartridge was sealed with a foam material to prevent air leakage underneath which would bypass the biochar. The air from the outside the PSBORS was introduced to the bottom of the unit by a blower (Model R1102m GastIDEX, Benton Harbor, MI, USA), flowing through the biochar inside the cartridge, and exiting the unit from the top of the cartridge via a 7.6 cm PVC pipe. The flow through the PSBORS was estimated using measured pressure drop, and the performance curve of the blower. The pressure drop associated with the PSBORS filter cartridge filled with the commercial biochar (29.0 kg) was 47.7 Pa. The flow rate was 765 L/min, and the corresponding superficial velocity was 0.026 m/s. The biochar cartridges were designed to easily replace the spent biochar in the cartridge with a new cartridge with fresh biochar. The influent samples were collected at the bottom air space of the unit and the effluent samples were collected from the top PVC exit pipe. The effectiveness of the PSBORS for removing odorous volatile organic compounds (VOCs) was evaluated by placing and running the unit inside the swine gestation pen continuously for 21 days, and collecting both influent and effluent daily air samples during the 21 days except for weekends. The manure pit was emptied every 30 days. The pit had been emptied and manure allowed to accumulate for 7 days before the study was initiated and the final day of data collection occurred on day 21 of the study.
Because H2S concentration in the gestation barn was less than the detection limit of 0.1 ppm of the PID analyzer, the PSBORS was placed outside the barn and modified so that its effectiveness in removing H2S was independently evaluated by introducing two known concentrations of H2S gas (71.9 ± 5.2 and 308.5 ± 33.0 ppm) from the cylinder directly into the unit. The two influent concentrations were chosen either to maximize the duration of run (39.3 h) using two 500-ppm gas tanks, or influent concentration (308.5 ppm for 9.2 h) using one 1020 ppm gas tank. Similar to the bench-scale biochar column, a humidified air from the humidity generator (Model #2500, Thunder Scientific Corp, Albuquerque, NM, USA) was combined with the dry H2S gas stream from the flow controller (SmartTrack #C100L, Sierra Instruments, Monterey, CA, USA) attached to a 500 ppm (for the 71.0-ppm flow) or a 1020 ppm (for the 308.5-ppm flow) calibrated H2S gas cylinder (Praxair, Danbury, CT, USA). The humidified H2S was then fed into the bottom of the PSBORS, thru the biochar cartridge, and exited from the top of the PSBORS. The influent and effluent H2S concentrations of the PSBORS were measured using the PID H2S analyzer. The differential pressure was measured over the biochar depth using a micro manometer (model #5825, TSI Inc., Shoreview, MN, USA).
2.4. Analyses of Odorous VOCs, H2S, and SCOAVs
The concentrations of odorous VOCs in the influent and effluent streams were measured using thermal desorption sorbent tubes similar to Hwang et al. [18]. Influent and effluent gas samples were pulled and passed through the sorbent tubes (Markes International, #C1-AAXX-5003, Sacramento, CA, USA) at 75 mL/min for a duration of 20 min (i.e., 1.5 L of a total sample volume) using small pumps (SKC, #210-1002 pocket pump and #220-5000TC Aircheck Touch, Eighty Four, PA, USA). The odorous VOCs sorbed on the sorbent tubes were analyzed using a thermal desorption–gas chromatography–mass spectrometry (TD-GC-MS). The TD–GC–MS system consisted of thermal desorber (Markes International, Inc., Wilmington, DE, USA) and Agilent 7890A GC with Agilent 5975C MS (Agilent Technologies, Inc., Santa Clara, CA, USA). The odorous VOCs consisted of volatile fatty acids (VFAs, acetic, propionic, isobutyric, butyric, isovaleric, valeric, hexanoic, heptanoic), phenolics (phenol, 4-methylphenol, 4-ehtyphenol), two indolics (indole, skatole), and two sulfides (dimethyl disulfide, dimethyl trisulfide). Previous studies found that some combination of these compounds contributed toward swine odor [13,27,28,29,30]. More detailed analytical procedure and detection limits can be found in Hwang et al. [18].
The single compound odor threshold (SCOT) is the lowest concentration an odor can be recognized by a human. The relative contribution of a single compound to the overall odor of a complex mixture of odorous compounds can be estimated using the single compound odor active value (SCOAV) [18,31]. The SCOAV is the ratio of a mass concentration to the SCOT (i.e., SCOAV = mass concentration/SCOT). The SCOAV does not account for synergistic/antagonistic interactions nor hedonic tones of many different odorous compounds. However, Zahn et al. [30] demonstrated that synergistic and antagonistic effects were minor contributors to intensity of swine odor. Also, the use of SCOAV is a logical first step in determining which single compounds contribute most to the complex odor from swine facilities. Parker et al. [27] concluded that the sum of SCOAV account for 1/3 to 1/2 of the odor concentration and are a useful tool for assessing general trends in odor concentration.
2.5. Statistical Methods
The central tendency and precision of measurements were presented with arithmetic averages and standard deviations (given as ± values). When comparing two sample means, both groups of data were assumed to be normally distributed but not having the same standard deviation (Welch’s correction in t tests). The differences were considered to be significant at p < 0.05. All of the statistical parameters and tests were obtained/performed using GraphPad Prism 8.43 (GraphPad Software, Inc., La Jolla, CA, USA).
3. Results and Discussion
3.1. Biochar Characteristics
Table 1 shows the physicochemical properties of the commercial biochar made from pine wood (CBC). The pH of CBC used in this study is 6.7, which is similar to the pH of 6.8 for the biochar made from pine wood chip at pyrolysis temperature of 465 °C (465BC) [32]. However, volatile matter (VM) ranging from 34.9 to 72.3% for the 465BC is significantly higher than 13.6% for the CBC used in this study. This significant difference in VM may be caused by the fact that the CBC was more deeply carbonized at a higher pyrolysis temperature of 600 °C, resulting in lower O content (<0.01%) for CBC than for 465BC (9.0–11.0%). Although the duration of pyrolysis for the 465BC was not reported, these properties of biochar could also be affected by pyrolysis time. From kinetic simulation, Ro reported the decrease in biochar VM and increase in fixed carbon (FC) with pyrolysis time [33]. Jiang et al. also found similar trends and reported that C content increased and O contents decreased with pyrolysis time [34]. The significant decrease in VM of the commercial biochar may also relate to the significantly higher BET surface area of 102 m2/g for CBC compared to only 0.1–0.2 m2/g for 465BC.
When the biochar is no longer effective in removing odorants due to saturation, the spent biochar must be replaced with fresh biochar. Hwang et al. reported plant-based biochar maximum adsorption capacities of two significant swine odorous VOCs, DMDS, and DMTS, in the range of 3.3 to 15 µg/g [18]. Because H2S sorption capacity of the CBC is probably much larger than that for odorous VOCs (mg/g instead of µg/g ranges), the spent biochar will not be saturated with toxic H2S but with trace-level odorous VOCs. Although we have not found any study done on the use of spent biochar adsorbed with trace-level odorous VOCs and H2S for soil applications, we speculate that it has high potential to be used as a soil amendment without much environmental and health complications due to extremely low concentrations. Table 1 also shows the elemental analyses of the commercial biochar for the US Environmental Protection Agency (EPA)’s Part 503 biosolid pollutant ceiling concentrations for agricultural applications. The biochar contains practically negligible amounts of these Part 503 pollutants. Furthermore, if applied to soil at a rate of 1.3% (i.e., about 27215 kg/ha) as reported by Novak et al. [35], the Part 503 pollutant concentrations in the spent CBC would be further diluted to 1.3%. Therefore, the spent biochar would be safe for agricultural applications according to the EPA’s Part 503 pollutants.
3.2. Pressure Drop
Pressure drop across the biochar column is an important factor for sizing blower power requirements for the biochar odor removal system. The Ergon equation is frequently used to estimate the pressure drop based on the flow velocity and the packing particle size and shape [36,37]:
where is a pressure drop across the biochar column (Pa), L is the height of the biochar column (m), U is the superficial velocity (m/s), d is the characteristic biochar particle diameter (m), is the sphericity of the biochar particles, is the porosity, is the viscosity of air (kg/m/s), and is the density of the air (kg/m3).
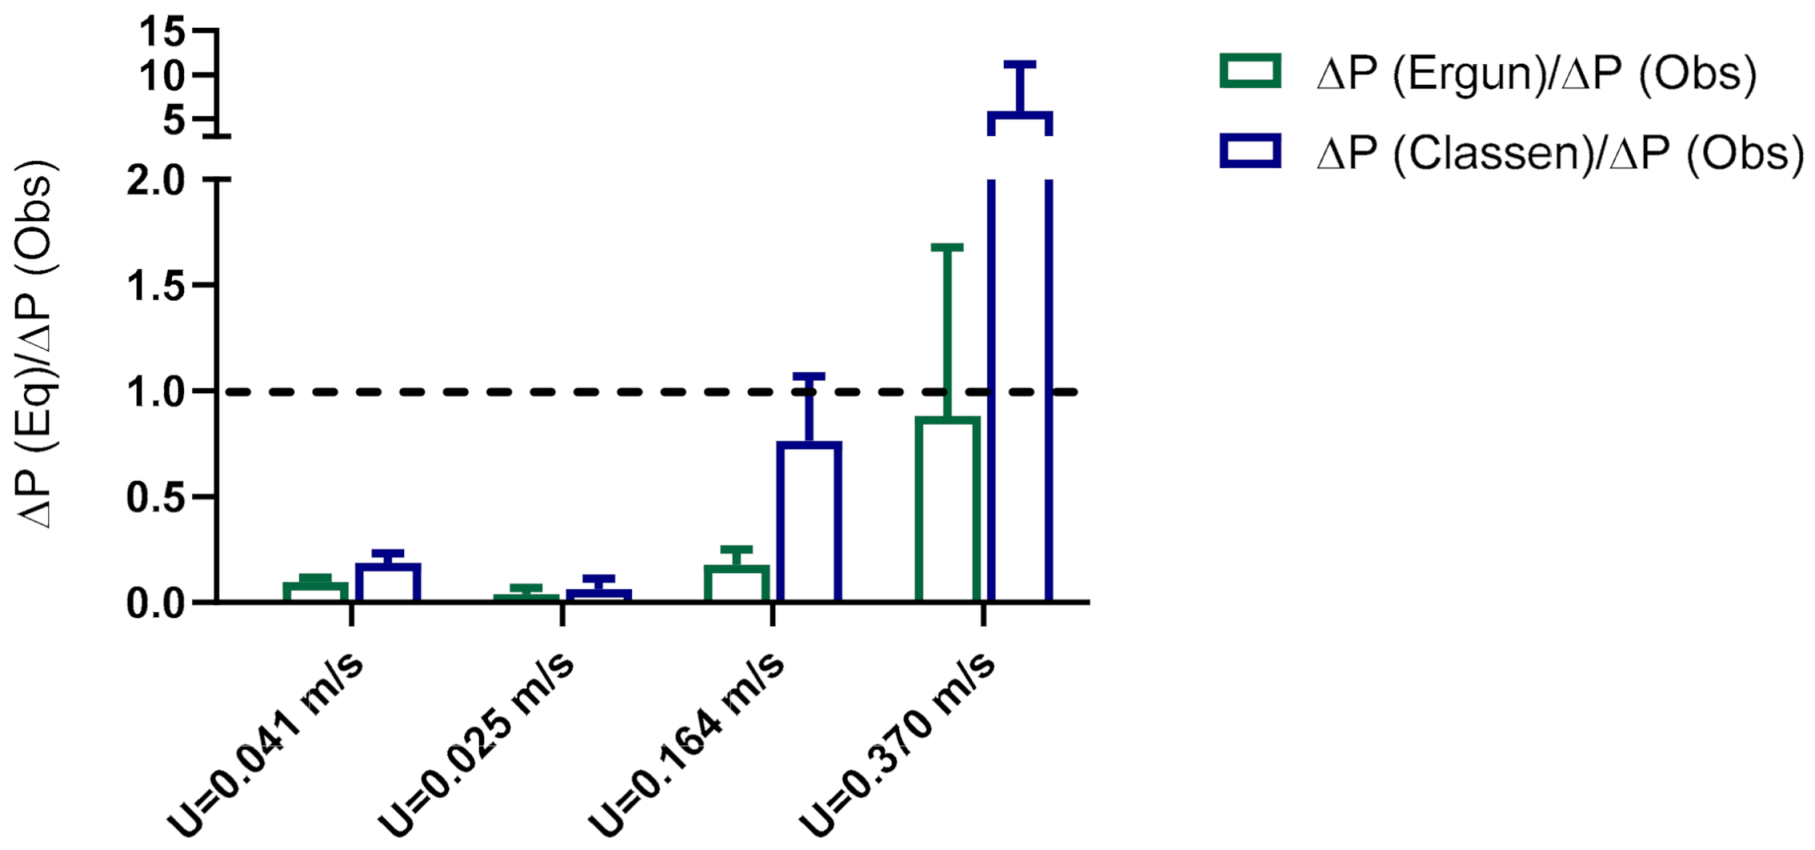
The commercial biochar particles were not spherical nor uniform. Therefore, their size and shape were characterized as ellipsoidal particles with uniform size and shape using the Sauter mean diameter (i.e., the mean volume-surface diameter) and the sphericity (i.e., the ratio of the surface area of an equal-volume sphere to the actual surface area of the biochar particles) [36]. The Sauter mean diameter and the sphericity were determined from three batches of randomly selected biochar particle samples (>100 particles per batch). The characteristic Sauter mean diameter of 1.90 cm and the sphericity of 0.92 were used in Equation (2) to predict the pressure drop of the biochar column at four different superficial velocities (Figure 3). The overall ratio of predicted from the Ergun equation (Equation (2)) to the observed (i.e., ΔP (Ergun)/ΔP (Obs)) was 0.30 ± 0.39 (Figure 3). At low superficial velocities (U) of 0.041, 0.025, and 0.164 m/s, Equation (2) significantly underestimated pressure drops with an average ΔP (Ergun)/ΔP (Obs) of 0.12 ± 0.07. However, at U = 0.37 m/s, the ratio increased to 0.88 ± 0.80. Classen et al. also suggested an empirical pressure drop equation for a pilot-scale biofiltration system as [38]:
Interestingly, this equation over-predicted the pressure drop with an overall ratio ΔP (Classen)/ΔP (Obs) of 1.66 ± 3.32. At U ≤ 0.164 m/s, the ratio ΔP (Classen)/ΔP (Obs) decreased to 0.41 ± 0.36. These two equations did not appear to be adequate for predicting the pressure drop of the biochar-packed system. It may be necessary to actually measure the pressure drop of a full-scale prototype for the accurate sizing of the blower and power requirement estimation.
3.3. H2S Breakthrough Adsorption Capacity of CBC Using Bench-Scale Biochar Column
The performance of the commercial biochar as an adsorbent for H2S is shown in Table 2. For the influent H2S concentrations of 72.0 to 74.5 ppm, the H2S sorption capacity of the commercial biochar under humid (RH = 64.0%) condition (2.51 ± 0.32 mg/g) was significantly higher than 0.34 ± 0.13 mg/g for dry (RH = 23.9%) condition (p = 0.0046). The higher H2S sorption capacities of various activated carbons under humid conditions were also reported in the literature [39]. Using influent H2S concentration of 3000 ppm, Bandosz reported the 500-ppm breakthrough capacities ranging from 5 to 295 mg/g under humid conditions and 2.5 to 9.5 mg/g under dry conditions. The proposed mechanism in the literature for H2S adsorption on the carbon surface of untreated biochar or activated carbon involves these steps; (a) adsorption on the surface, (b) the H2S dissolution in a water film on the surface, (c) dissociation of H2S in the water film, and (d) surface reaction with adsorbed oxygen to form elemental sulfur or sulfur oxides [40,41]. Therefore, the formation of a surface water film from the humid air explains the higher sorption capacity under humid conditions observed in this study.
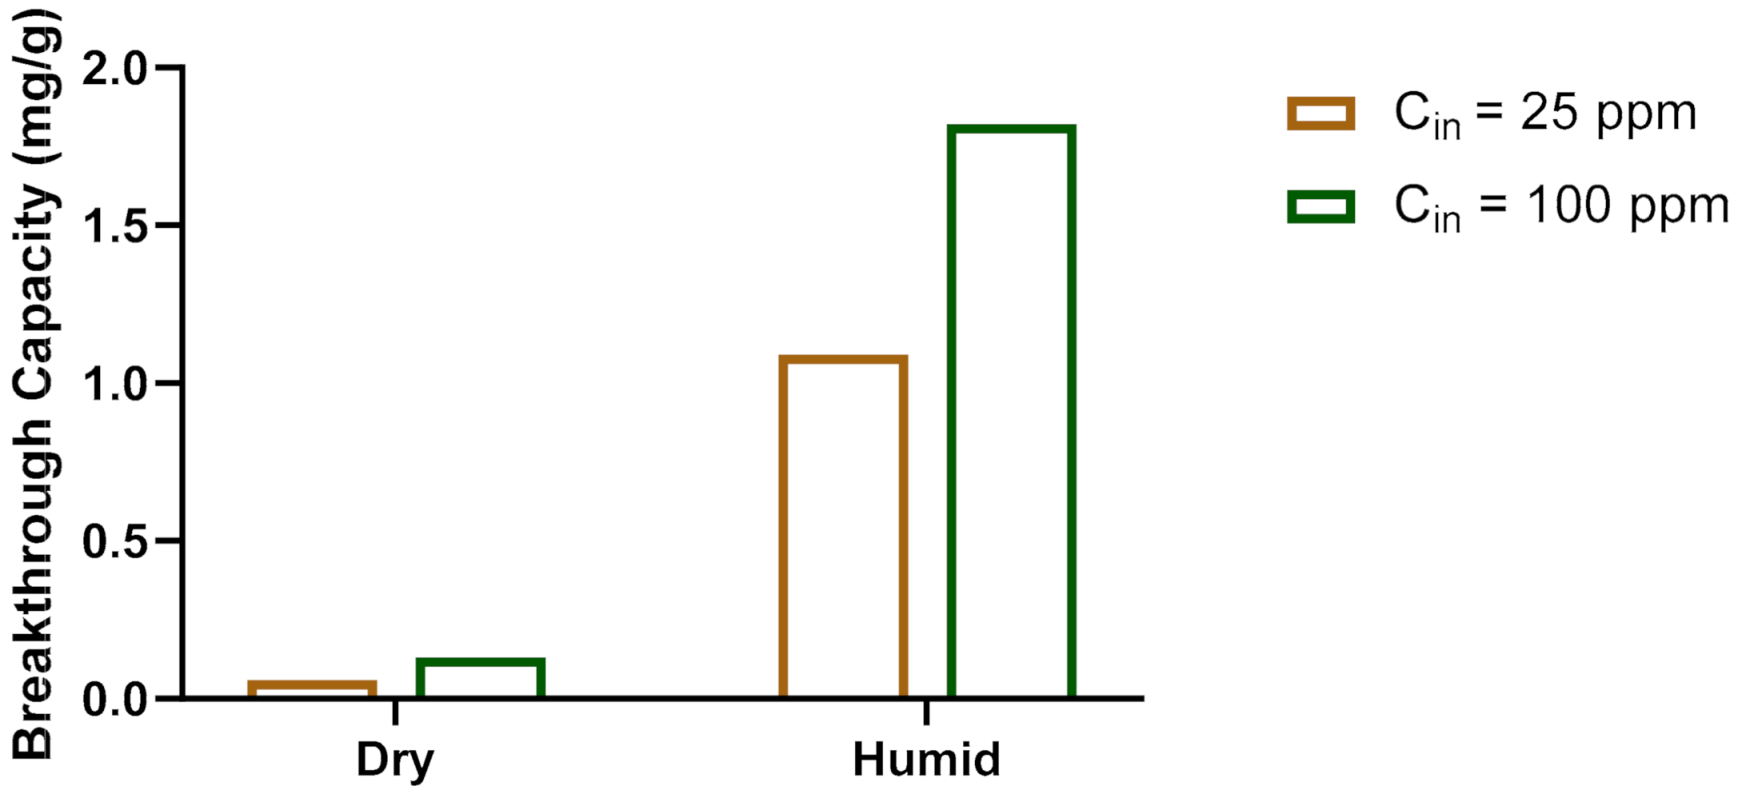
In addition to humidity, much higher influent H2S concentration and larger surface areas of the activated carbon used by Bandosz probably contributed to the significantly higher breakthrough sorption capacities. The impact of influent concentration on the sorption capacity was evaluated using influent H2S concentrations of 25 and 100 ppm (U = 0.041 m/s). The sorption capacity increased from 0.06 mg/g with Cin = 25.9 ppm to 0.13 mg/g with Cin = 99.9 ppm under dry condition, while the sorption capacity increased from 1.09 mg/g with Cin = 24.0 ppm to 1.82 mg/g with Cin = 99.9 ppm under humid conditions (Figure 4).
3.4. Performance of the Pilot-Scale Biochar Odor Removal System (PSBORS)
3.4.1. Removal of Odorous VOCs
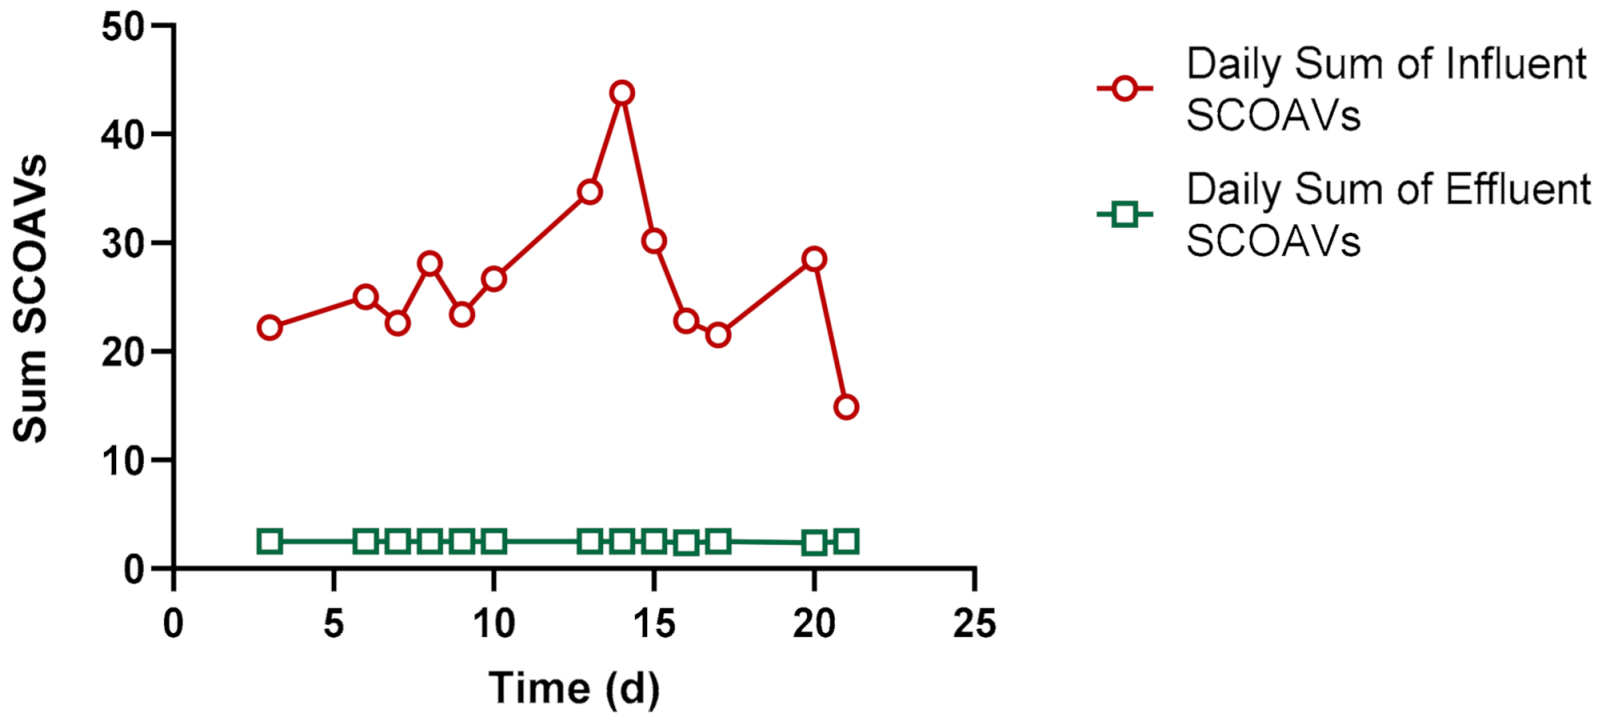
Table 3 and Figure 5 show the influent and effluent concentrations of the 15 odorous volatile organic compounds (VOCs) and daily sums of SCOAVs of the PSBORS, respectively. While the influent concentrations of six of the 15 tested VOCs were below the detection limit (BDL), the effluent concentrations of all but one VOCs were BDL. Acetic acid was the VOC with the highest influent concentration (347 ng/L) and the only VOC with an effluent concentration above BDL (125 ng/L). Although the concentration of acetic acid was the highest, its relative impact on the odor was not the highest due to its high single compound odor threshold (SCOT) of 578 ng/L. Its influent SCOAV was only 0.6. Although the influent concentration of 4-mthyl phenol was only about 1/10 of that of acetic acid, its contribution to odor was 23 times higher according to their SCOAV values (0.6 vs. 13.65). The average daily sums of SCOAVs in the influent and effluent were 26.5 ± 7.1 and 2.5 ± 0.0, respectively (p < 0.001, Table 3). It clearly shows that the total SCOAVs in the influent were reduced considerably during the 21 days of operation.
3.4.2. Removal of H2S
Due to limitations from safety requirements and the number of available H2S gas cylinders, we shortened the duration of the experimental runs to either 39.3 h with an influent concentration of 71.9 pm or 9.2 h with an influent concentration of 308.5 ppm (Table 4). In both runs, the effluent H2S concentrations were below the detection limit of 0.1 ppm.
4. Conclusions
This study evaluated the efficacy of commercially available biochar as an adsorption filter medium to remove H2S and odorous VOCs. The CBC was made from pine wood chip and had higher fixed carbon and carbon contents than the pine biochar made at a lower pyrolysis temperature of 465 °C. The CBC contains practically negligible amounts of the Part 503 pollutants, suggesting that the spent biochar could be safely recycled as a soil amendment, provided adsorbed VOCs and other compounds do not affect the soil health negatively. The CBC has a characteristic Sauter mean diameter of 1.90 cm with a sphericity of 0.92. The well-known Ergun equation may not be adequate in estimating the pressure drop as it significantly underestimates measured pressure drops. On the other hand, the Classen model over-predicted the pressure drop. The H2S breakthrough capacity was determined using a continuous-flow sorption column filled with the CBC. The breakthrough adsorption capacity of the CBC at the influent concentrations of 72.0 to 74.5 ppm was 2.51 mg/g under humid conditions, which was much higher than that for dry conditions. The breakthrough capacities increased with the influent concentration of H2S. The PSBORS’ efficacy for removing 15 odorous VOCs was evaluated in a swine gestation barn treating the inside air constantly for 21 days. All 15 odorous VOCs in the PSBORS effluent were below the detection limit except for acetic acid with 125 ng/L. However, due to its very high odor threshold, its contribution (SCOAV = 0.22) to the total odor in the effluent (total effluent SCOAV = 2.5) was less than 10%. The H2S removal efficiency of the PSBORS was determined using influent H2S concentrations of 71.9 and 308.5 ppm. The H2S concentration in the PSBORs was below detection limit. Although the service time for the PSBORS was not evaluated, it appeared that the CBC can be used to reduce both H2S and odorous VOCs with the potential of recycling the spent CBC for soil health improvement after using it for H2S and odor removal.
Author Contributions
Conceptualization, K.S.R., O.H. and S.C.; methodology, B.W., M.S., A.A.S. and P.J.S.; experiments, K.S.R., A.A.S., B.W. and M.S.; resources, K.S.R., A.A.S., S.C. and B.W.; data curation, K.S.R., B.W., M.S., O.H. and P.J.S.; writing—original draft preparation, K.S.R.; writing—review and editing, all authors.; supervision, K.S.R.; project administration, K.S.R. and S.C.; funding acquisition, K.S.R. and S.C. All authors have read and agreed to the published version of the manuscript.
Funding
This research was supported by the cooperative agreement between USDA-ARS and Korean RDA-NIAS (58-0210-002FM).
Institutional Review Board Statement
Not applicable.
Informed Consent Statement
Not applicable.
Data Availability Statement
The data presented in this study will be published and openly available to the public in the data repository Dryad (dryad.org) or an equivalent data repository within 30 months after the date of publication and catalogues in the National Agricultural Library (NAL) Ag Data Common with additional information on the USDA funding, data set description, and associated publications.
Acknowledgments
The authors would like to acknowledge the technical support provided by Melvin Johnson and Paul Shumaker of the USDA-ARS Coastal Plains Soil, Water and Plant Research Center, Florence, SC, Alan Kruger and Todd Boman, USDA-ARS Meat Animal Research Center, Clay Center, NE, and Anna Foote of the USDA-ARS Food Animal Environmental Systems Research Unit. This research was supported by the USDA-ARS National Program 212 Soil and Air. Mention of trade names or commercial products is solely for the purpose of providing specific information and does not imply recommendation or endorsement by the U.S. Department of Agriculture.
Conflicts of Interest
The authors declare no conflict of interest.
References
- Arogo, J.; Zhang, R.H.; Riskowski, G.L.; Day, D.L. Hydrogen Sulfide Production from Stored Liquid Swine Manure. Trans. ASABE 2000, 43, 1241–1245. [Google Scholar] [CrossRef]
- Elenbaas-Thomas, A.M.; Zhao, Y.; Hyun, Y.; Wang, X.; Anderson, B.; Riskowski, G.L.; Ellis, M.; Heber, A.J. Effects of Room Ozonation on Air Quality and Pig Performance. Trans. ASABE 2005, 48, 1167–1173. [Google Scholar] [CrossRef]
- Gay, S.W.; Schmid, D.R.; Clanton, C.J.; Janni, K.A.; Jacobson, L.D.; Weisberg, G.L. Odor, Total Reduced Sulfure, and Ammonia Emissions from Animal Housing Facilities and Manure Storage Units in Minnesota. Appl. Eng. Agric. 2003, 19, 347–360. [Google Scholar]
- NRC. Air Emissions from Animal Feeding Operations: Current Knowledge, Future Needs; The National Academies Press: Washington, DC, USA, 2003. [Google Scholar]
- Koelsch, R.K.; Woodbury, B.L.; Stenberg, D.E.; Miller, D.N.; Schulte, D.D. Total Reduced Sulfur Concentrations in the Vicinity of Beef Cattle Feedlots. Appl. Eng. Agric. 2004, 20, 77–85. [Google Scholar] [CrossRef]
- Donham, K.J.; Wing, S.; Osterberg, D.; Flora, J.L.; Hodne, C.; Thu, K.M.; Thorne, P.S. Community Health and Socioeconomic Issues Surrounding Concentrated Feeding Operations. Environ. Health Perspect. 2007, 115, 317–320. [Google Scholar] [CrossRef] [PubMed] [Green Version]
- Wing, S.; Horton, R.A.; Marshall, S.W.; Thu, K.M.; Taiik, M.; Schinasi, L.; Schiffman, S.S. Air Pollution and Odor in Communities near Industrial Swine Operations. Environ. Health Perspect. 2008, 116, 1362–1368. [Google Scholar] [CrossRef] [PubMed]
- Blanes-Vidal, V.; Hansen, M.N.; Adamsen, A.P.S.; Feilberg, A.; Petersen, S.O.; Jensen, B.B. Characterization of Odor Released During Handling of Swine Slurry: Part I. Relationship between Odorants and Perceived Odor Concentrations. Atmos. Environ. 2009, 43, 2997–3005. [Google Scholar] [CrossRef]
- Blanes-Vidal, V.; Hansen, M.N.; Adamsen, A.P.S.; Feilberg, A.; Petersen, S.O.; Jensen, B.B. Characterization of Odor Released during Handling of Swine Slurry: Part II. Effect of Production Type, Storage and Physicochemical Characteristics of the Slurry. Atmos. Environ. 2009, 43, 3006–3014. [Google Scholar] [CrossRef]
- Jo, S.-H.; Kim, K.-H.; Jeon, B.-H.; Lee, M.-H.; Kim, Y.-H.; Kim, B.-W.; Cho, S.-B.; Hwang, O.-W.; Bhattacharay, S.S. Odor Characterization from Barns and Slurry Treatment Facilities at a Commercial Swine Facility in South Korea. Atmos. Environ. 2015, 119, 339–347. [Google Scholar] [CrossRef]
- Lo, Y.-C.M.; Koziel, J.A.; Cai, L.; Hoff, S.J.; Jenks, W.S.; Xin, H. Simultaneous Chemical Sensory Characterization of Volatile Organic Compounds and Semi-Volatile Organic Compounds Emitted from Swine Manure using Solid Phase Microextraction and Multidimensional Gas Chromatography-Mass Spectrometry-Olfactometry. J. Environ. Qual. 2008, 37, 521–534. [Google Scholar] [CrossRef]
- Schiffman, S.S.; Bennett, J.L.; Raymer, J.H. Quantification of Odors and Odorants from Swine Operations in North Carolina. Agric. For. Meteorol. 2001, 108, 213–240. [Google Scholar] [CrossRef]
- Parker, D.B.; Gilley, J.; Woodbury, B.L.; Kim, K.-H.; Galvin, G.; Bartelt-Hunt, S.L.; Li, X.; Snow, D.D. Odorous VOC Emission Following Land Application of Swine Manure Slurry. Atmos. Environ. 2013, 66, 91–100. [Google Scholar] [CrossRef] [Green Version]
- Maurer, D.L.; Koziel, J.A.; Harmon, J.D.; Hoff, S.J.; Rieck-Hinz, A.M.; Anderson, D.S. Summary of Performance Data for Technologies to Control Gaseous, Odor, and Particulate Emission from Livestock Operations: Air Management Practices Assessment tool (AMPAT). Data Brief 2016, 7, 1413–1429. [Google Scholar] [CrossRef] [PubMed] [Green Version]
- Kalus, K.; Koziel, J.A.; Opalinski, S. A Review of Biochar Properties and their Utiliaiton in Crop Agriculture and Livestock Production. Appl. Sci. 2019, 9, 3494. [Google Scholar] [CrossRef] [Green Version]
- Schmidt, H.-P.; Hagemann, N.; Draper, K.; Kammann, C. The Use of Biochar in Animal Feeding. Peer J. 2019, 7, e7373. [Google Scholar] [CrossRef] [Green Version]
- Novak, J.M.; Spokas, K.A.; Cantrell, K.; Ro, K.S.; Watts, D.W.; Glaz, B.; Busscher, W.J.; Hunt, P.G. Effects of Biochars and Hydrochars Produced from Lignocellulosic and Animal Manure on Fertility of a Mollisol and Entisol. Soil Use Manag. 2014, 30, 175–181. [Google Scholar] [CrossRef]
- Hwang, O.; Lee, S.-R.; Cho, S.; Ro, K.S.; Spiechs, M.; Woodbury, B.L.; Silva, P.J.; Han, D.-W.; Choi, H.; Kim, K.-Y.; et al. Efficacy of Different Biochars in Removing Odorous Volatile Organic Compounds (VOCs) Emitted from Swine Manure. ACS Sustain. Chem. Eng. 2018, 6, 14239–14247. [Google Scholar] [CrossRef]
- Ro, K.S.; Lima, I.M.; Reddy, G.B.; Jackson, M.A.; Gao, B. Removing Gaseous NH3 using Biochar as an Adsorbent. Agriculture 2015, 5, 991–1002. [Google Scholar] [CrossRef] [Green Version]
- Sikora, F.J.; Moore, K.P. (Eds.) Soil Test Methods from the Southeastern United States; Southern Cooperative Series Bulletin No. 419; University of Kentuky: Lexington, KY, USA, 2014; ISBN 1-58161-419-5. [Google Scholar]
- Kalus, K.; Konkol, D.; Korczynski, M.; Koziel, J.A.; Opalinski, S. Laying Hens Biochar Diet Supplementation–Effect on Performance, Excreta N Content, NH3, and VOCs Emissions, Egg Traits and Egg Consumers Acceptance. Agriculture 2020, 10, 237. [Google Scholar] [CrossRef]
- Kalus, K.; Konkol, D.; Korczynski, M.; Koziel, J.A.; Opalinski, S. Effect of Biochar Diet Supplementation on Chicken Broilers Performance, NH3 and Odor Emissions and Meat Consumer Acceptance. Animals 2020, 10, 1539. [Google Scholar] [CrossRef] [PubMed]
- BiocharNow. Available online: https://biocharnow.com/ (accessed on 8 March 2021).
- Pordesimo, L.O.; Igathinathane, C.; Bevans, B.D.; Holzgrafe, D.P. Potential of Dimensional Measurenments of Individual Pellets as Another Measure for Evaluating Pellet Quality. In American Society of Agricultural and Biological Engineers; ASABE, Ed.; ASABE: Pittsburg, PA, USA, 2010. [Google Scholar]
- Walker, J.; Knight, L.; Stein, L. A Plain English Guide to the EPA Part 503 Bioslids Rule. In U.S. Environmental Protection Agency; Report No.=EPA/832/R-93/003; U.S. Environmental Protection Agency: Washington, DC, USA, 1994. [Google Scholar]
- ALEC. Available online: https://www.alec.arizona.edu/ (accessed on 11 August 2021).
- Parker, D.B.; Malone, G.W.; Walter, W.D. Vegetative Environmental Buffers and Exhaust Fan Deflectors for Reducing Downwind Odor and VOCs from Tunnel-Ventilated Swine Barns. Trans. ASABE 2012, 55, 227–240. [Google Scholar] [CrossRef]
- Zahn, J.A.; Hatfield, J.L.; Do, Y.S.; DiSpirito, A.A.; Laird, D.A.; Pfeiffer, R.L. Characterization of Volatile Organic Emissions and Wastes from a Swine Production Facility. J. Environ. Qual. 1997, 26, 1687–1696. [Google Scholar] [CrossRef]
- Trabue, S.L.; Anhalt, J.C.; Zahn, J.A. Bias of Tedlar Bags in the Measurement of Agricultural Odorants. J. Environ. Qual. 2006, 35, 1668–1677. [Google Scholar] [CrossRef] [PubMed]
- Zahn, J.A.; DiSpirito, A.A.; Do, Y.S.; Brooks, B.E.; Cooper, E.E.; Hatfield, J.L. Correlation of Human Olfactory Responses to Airborne Concentrations of Malodorous Volatile Organic Compounds Emitted from Swine Effluent. J. Environ. Qual. 2001, 30, 624–634. [Google Scholar] [CrossRef] [PubMed] [Green Version]
- Woodbury, B.L.; Gilley, J.; Parker, D.B.; Marx, D.B.; Miller, D.N.; Eigenberg, R.A. Emission of Volatile Organic Compounds after Land Application of Cattle Manure. J. Environ. Qual. 2014, 43, 1207–1218. [Google Scholar] [CrossRef] [Green Version]
- Spokas, K.A.; Novak, J.M.; Stewart, C.E.; Cantrell, K.; Uchimiya, M.; DiSaire, M.G.; Ro, K.S. Qualitative Analysis of Volatile Organic Compounds on Biochar. Chemosphere 2011, 85, 869–882. [Google Scholar] [CrossRef]
- Ro, K.S. Kinetics and Energetics of Producing Animal Manure-based Biochar. Bioenergy Res. 2016, 9, 447–453. [Google Scholar] [CrossRef]
- Zhang, J.; Liu, J.; Liu, R. Effects of Pyrolysis Temperature and Heating Time on Biochar Obtained from the Pyrolysis of Straw and Lignosulfonate. Bioresour. Technol. 2015, 176, 288–291. [Google Scholar] [CrossRef]
- Novak, J.M.; Watts, D.W.; Sigua, G.C.; Ducey, T.F. Corn Grain and Stover Nutrient Uptake Responses from Sandy Soil Treated with Designer Biochars and Compost. Agronomy 2021, 11, 942. [Google Scholar] [CrossRef]
- Ro, K.S.; McConnell, L.L.; Johnson, M.H.; Hunt, P.G.; Parker, D. Livestock Air Treatment using PVA-coated Powdered Activated Carbon Biofilter. Appl. Eng. Agric. 2008, 24, 791–798. [Google Scholar]
- Ergun, S. Fluid Flow through Packed Columns. Chem. Eng. Prog. 1952, 48, 89–94. [Google Scholar]
- Classen, J.J.; Young, J.S.; Bottcher, R.W.; Westerman, P.W. Design and Analysis of a Pilot Scale Biofiltration System for Odorous Air. Trans. ASABE 2000, 43, 111–118. [Google Scholar] [CrossRef]
- Bandosz, T.J.; Bagreev, A.; Adib, F.; Turk, A. Unmodified Versus Caustics-Impregnated Carbons for Control of Hydrogen Sulfide Emissions from Sewage Treatment Plants. Environ. Sci. Technol. 2000, 34, 1069–1074. [Google Scholar] [CrossRef]
- Shang, G.; Li, Q.; Liu, L.; Chen, P.; Huang, X. Adsorption of Hydorgen Sulfide by Biochars Derived from Pyrolysis of Different Agricultural/Forestry Wastes. J. Air Wastes Manag. Assoc. 2016, 66, 8–16. [Google Scholar] [CrossRef] [PubMed] [Green Version]
- Bandosz, T.J. On the Adsorption/Oxidation of Hydrogen Sulfide on Activated Carbons at Ambient Temperatures. J. Colloid Interface Sci. 2002, 246, 1–20. [Google Scholar] [CrossRef]
- Feilberg, A.; Nyord, T.; Hansen, M.N.; Lindholst, S. Chemical Evaluation of Odor Reduction by Soil Injection of Animal Manure. J. Environ. Qual. 2011, 40, 1674–1682. [Google Scholar] [CrossRef] [PubMed]
Figure 1.
Bench-scale biochar column.

Figure 2.
Pilot-scale biochar odor removal system (PSBORS) inside a swine nursery pen.

Figure 3.
Comparison of pressure drop predicted using equation by Ergun [37] and Classen et al. [38] to observed values.

Figure 4.
Impact of influent concentration on the 50% breakthrough sorption capacity of biochar under dry (RH = 3.4%) and humid (RH = 55.9%) conditions (Cin = influent H2S concentration).
Figure 4.
Impact of influent concentration on the 50% breakthrough sorption capacity of biochar under dry (RH = 3.4%) and humid (RH = 55.9%) conditions (Cin = influent H2S concentration).

Figure 5.
Daily sum of influent and effluent SCOAVs.


Table 1.
Commercial pine biochar characteristics.
| Property | Commercial Pine Biochar † |
|---|---|
| pH | 6.7 ± 0.5 |
| Moisture content (%) | 2.8 ± 0.03 |
| BET surface area (m2/g) | 102 ± 22 |
| Sauter mean diameter (cm) | 1.90 ± 0.04 |
| Sphericity | 0.92 ± 0.01 |
| Proximate properties | |
| Volatile matter (%db ‡) | 14.0 ± 0.14 |
| Fixed carbon (%db ‡) | 81.7 ± 0.08 |
| Ash (%db ‡) | 4.3 ± 0.14 |
| Ultimate properties | |
| C (%db ‡) | 94.3 ± 0.06 |
| H (%db) | 2.3 ± 0.02 |
| N (%db) | 0.37 ± 0.02 |
| O (%db) | < 0.01 |
| Part 503 Elements | |
| As, μg/g (75) § | 0.30 ± 0.04 |
| Cr, μg/g (3000) § | 8.59 ± 1.18 |
| Cu, μg/g (4300) § | 3.91 ± 0.26 |
| Pb, μg/g (840) § | 0.88 ± 0.02 |
| Mo, μg/g (75) § | 0.21 ± 0.03 |
| Ni, μg/g (420) § | 1.26 ± 0.21 |
| Se, μg/g (100) § | 0.26 ± 0.05 |
| Zn, μg/g (7500) § | 25.76 ± 0.76 |
† Triplicate samples except for duplicate BET surface area; ‡ dry weight basis, § ceiling concentrations of USEPA’s Part 503 pollutants for biosolids.
Table 2.
Breakthrough capacities of the commercial biochar.
| Dry | Humid | |
|---|---|---|
| Number of samples | 3 | 3 |
| Relative humidity, RH (%) | 23.9 ± 1.7 | 64.0 ± 1.5 |
| Temperature, T (°C) | 18.6 ± 1.8 | 19.3 ± 1.0 |
| Superficial velocity, U (m/s) | 0.055 | 0.055 |
| Influent concentration (ppm) | 74.5 ± 0.8 | 72.0 ± 2.5 |
| Breakthrough capacity (mg/g) | 0.34 ± 0.13 | 2.51 ± 0.32 |
Table 3.
Average influent and effluent concentrations of odorous volatile organic compounds and corresponding SCOAVs for 21 days (n = 15) of operation.
Table 3.
Average influent and effluent concentrations of odorous volatile organic compounds and corresponding SCOAVs for 21 days (n = 15) of operation.
| Compounds | SCOT (ng/L) | DL (ng/L) | Influent Concentration (ng/L) | Influent SCOAV | Effluent Concentration (ng/L) | Effluent SCOAV |
|---|---|---|---|---|---|---|
| DMDS | 12 | 0.3 | 4.1 ± 2.4 | 0.34 | BDL † | 0.03 ‡ |
| DMTS | 2 | 0.0 | 0.5 ± 0.4 | 0.23 | BDL | 0 ‡ |
| Acetic acid | 578 | 98 | 347 ± 259 | 0.60 | 125 ± 83 | 0.22 |
| Propionic acid | 106 | 18 | 47 ± 15 | 0.44 | BDL | 0.17 ‡ |
| i-Butyric acid | 38 | 0.4 | 8.0 ± 4.3 | 0.21 | BDL | 0.01 ‡ |
| Butyric acid | 6.9 | 1.1 | 9.9 ± 9.6 | 1.43 | BDL | 0.16 ‡ |
| i-Valeric acid | 2.3 | 9.8 | BDL | - | BDL | - |
| Valeric acid | 8.8 | 2.0 | BDL | - | BDL | - |
| Hexanoic acid | 69 | 1.2 | BDL | - | BDL | - |
| Heptanoic acid | 60 | 4.0 | BDL | - | BDL | - |
| Phenol | 206 | 86 | BDL | - | BDL | - |
| 4-methyl phenol | 1.3 | 2.2 | 30 ± 28 | 13.65 | BDL | 1.69 ‡ |
| 4-ethyl phenol | 6.3 | 2.7 | BDL | - | BDL | - |
| Indole | 2.1 | 0.1 | 0.2 ± 0.4 | 0.10 | BDL | 0.05 ‡ |
| Skatole | 0.48 | 0.1 | 0.1 ± 0.2 | 0.25 | BDL | 0.21 ‡ |
| Average daily sum of influent SCOAVs | 26.5 ± 7.1 | Average daily sum of effluent SCOAVs | 2.5 ± 0.0 |
† Below detection limit; ‡ for an effluent concentration below detection limit, its SCOAV was calculated as DL/SCOT.
Table 4.
Process conditions for PSBORS for H2S removal.
| Duration (h) | Flow Rate (LPM) | Biochar (kg) | SCDOT † (ppm) | DL (ppm) | RH (%) | Influent Concentration (ppm) | Effluent Concentration (ppm) |
|---|---|---|---|---|---|---|---|
| 39.3 | 20 | 27.4 | 0.002 | 0.1 | 61.6 ± 3.2 | 71.9 ± 5.2 | BDL |
| 9.2 | 25.5 | 10.2 | 0.002 | 0.1 | 64.2 ± 0.6 | 308.5 ± 33.0 | BDL |
† Single compound odor threshold by Feilberg et al. [42].
Publisher’s Note: MDPI stays neutral with regard to jurisdictional claims in published maps and institutional affiliations. |
© 2021 by the authors. Licensee MDPI, Basel, Switzerland. This article is an open access article distributed under the terms and conditions of the Creative Commons Attribution (CC BY) license (https://creativecommons.org/licenses/by/4.0/).
Share and Cite
MDPI and ACS Style
Ro, K.S.; Woodbury, B.; Spiehs, M.; Szogi, A.A.; Silva, P.J.; Hwang, O.; Cho, S. Pilot-Scale H2S and Swine Odor Removal System Using Commercially Available Biochar. Agronomy 2021, 11, 1611. https://doi.org/10.3390/agronomy11081611
AMA Style
Ro KS, Woodbury B, Spiehs M, Szogi AA, Silva PJ, Hwang O, Cho S. Pilot-Scale H2S and Swine Odor Removal System Using Commercially Available Biochar. Agronomy. 2021; 11(8):1611. https://doi.org/10.3390/agronomy11081611
Chicago/Turabian StyleRo, Kyoung S., Bryan Woodbury, Mindy Spiehs, Ariel A. Szogi, Philip J. Silva, Okhwa Hwang, and Sungback Cho. 2021. "Pilot-Scale H2S and Swine Odor Removal System Using Commercially Available Biochar" Agronomy 11, no. 8: 1611. https://doi.org/10.3390/agronomy11081611
Note that from the first issue of 2016, this journal uses article numbers instead of page numbers. See further details here.