
Dear New Yorkers:
I am pleased to share the Office of the Comptroller’s Annual Claims Report for Fiscal Year (FY) 2023, covering July 1, 2022 through June 30, 2023. Under the New York City Charter Section 93(i), the Comptroller is responsible for resolving claims on behalf of the City. This report examines claims filed against and on behalf of the City of New York and outlines trends by claim type across City agencies.
In FY 2023, 13,227 claims and lawsuits against New York City were resolved for $1.45 billion, $110.9 million less than the $1.56 billion paid out in FY 2022. For nearly a decade before FY 2022, the City paid approximately $1 billion per fiscal year to settle tort and law claims. The spike in FYs 2022 and 2023 were due in large part to judgments resulting from the decades-long Gulino class action lawsuit filed against DOE in 1996, in which the court found that state-mandated teacher certification exams discriminated against Black and Latino teachers. Based on a schedule agreed upon with plaintiffs, Gulino payouts will continue over the next four years.
We encourage City agencies to use this report as a risk management tool to reduce the number of claims filed each year to limit both future harm caused and the City’s financial exposure.
We invite the media, civic technologists, attorneys, creative risk managers, and New Yorkers to review this report to get a snapshot of the City’s financial liabilities. We welcome your feedback.
Sincerely,

Brad Lander
New York City Comptroller
I. Executive Summary
Under the New York City Charter, the Comptroller has the power to settle or adjust all claims in favor of or against the City.[1] This work is performed by the Comptroller’s Office Bureau of Law and Adjustment (BLA), which, under the direction of the Comptroller, the General Counsel, and the Assistant Comptroller for BLA, is composed of attorneys, claims professionals, and administrative staff.
In FY 2023, 13,227 claims and lawsuits against New York City were resolved for $1.45 billion[2], $110.9 million less than the $1.56 billion paid out in FY 2022. For nearly a decade before FY 2022, the City paid approximately $1 billion per fiscal year to settle tort and law claims. These payments increased by half a billion dollars in FY 2022 due, in large part, to salary claim settlements related to class and collective actions. As reported in last year’s report, in the Gulino v. Board of Education class action lawsuit, projected judgments of up to approximately $1.35 billion, plus other damages, are to be paid through a negotiated schedule across FY 2022-FY 2028. In addition, the City settled separate salary claims alleging violations of the Fair Labor Standards Act for $69.0 million. Together, these payouts totaled $435.8 million in FY 2022. While the City continues to pay out on both the Gulino class action and Fair Labor Standards Act cases, payouts of these class and collective actions were $176.1 million less in FY 2023, totaling $259.6 million.
Claims Filed and Settled FYs 2014–2023

Tort Claims
In FY 2023, City payouts on personal injury and property damage claims (collectively tort claims) which include allegations of slip and falls, medical malpractice, motor vehicle crashes, police action, and property damage claims increased minimally from FY 2022. The number of tort claims filed in FY 2023 decreased by six percent, and the amount paid out in settlements and judgments in FY 2023 increased by less than one percent. Moreover, New York taxpayers continue to pay for claims that were filed more than a decade ago.
- In FY 2023, the City paid out $739.6 million in tort claims, $1.8 million more than the $737.8 million paid out in FY 2022.[3]
- In FY 2023, the City paid out $77.4 million for personal injury claims that were filed prior to FY 2014 (“legacy claims”).
- Excluding legacy claim payments, personal injury claim payouts increased to $656.0 million in FY 2023 from $632.5 million in FY 2022.
Medical Malpractice Claims
- Since FY 2014—when 588 claims were filed—the number of medical malpractice claims filed has steadily declined. Still, the City continues to pay out costly settlements and judgments because of the large number of medical malpractice claims filed in years past, and because of the large amounts for individual claims. In FY 2023, there were 398 medical malpractice claims filed, down 10 percent from the 441 medical malpractice claims filed in FY 2022, but still down 37 percent from the 629 claims filed in FY 2015.
- Medical malpractice claim settlements and judgments in FY 2023 decreased to $51.5 million from $81.1 million in FY 2022.
Civil Rights Claims
- Civil rights claims decreased three percent to 1,450 claims filed in FY 2023, compared to 1,500 filed in FY 2022, and down 51 percent from the 2,937 claims filed in FY 2014. The cost of civil rights claim payouts increased to $145.4 million in FY 2023 up from $144.0 million in FY 2022, a one percent increase.
New York City Police Department Claims
- The number of tort claims filed against the New York City Police Department (NYPD) increased to 6,891 in FY 2023 from 4,588 in FY 2022, a 50 percent increase. FY 2023 represents the first time since FY 2014 that the number of tort claims filed against NYPD increased from the previous year.
- NYPD tort claim settlement and judgment payouts increased by 12 percent, to $266.7 million in FY 2023 from $239.1 million in FY 2022.
- The number of NYPD tort claim settlements and judgments decreased by two percent, to 2,821 in FY 2023 from 2,877 in FY 2022.
- Payouts on NYPD tort claims accounted for 36 percent of the total overall cost of the City’s resolved tort claims in FY 2023.
Department of Education Claims
- The number of tort claims filed against the Department of Education (DOE) increased to 1,352 in FY 2023 up from 1,153 in FY 2022, a 17 percent increase. This increase coincides with the return to in-person attendance in New York City public schools, after remote operations during the COVID-19 health emergency.
- In FY 2023, DOE tort claim settlement payouts totaled $92.8 million, a 12 percent increase from the $82.6 million paid out in FY 2022. A single post-verdict, post-appeal settlement of $36.3 million is responsible for the increase in the overall DOE settlement amount in FY 2022. It was the single most costly settlement in FY 2022. In FY 2023, a large driver for the $92.8 million in payouts were 19 settlements of $1 million or more, the majority of which were sexual assault cases revived by the Child Victims Act (CVA).
Motor Vehicle Claims
- Motor vehicle claims increased by 14 percent to 1,693 claims filed in FY 2023, up from 1,480 filed in FY 2022. The 1,693 motor vehicle claims filed in FY 2023 represents the highest number of motor vehicles claims filed against the City of New York since FY 2000.
- Motor Vehicle claim settlements and judgments in FY 2023 increased to $173.7 million from $141.1 million in FY 2022, a 23 percent increase.
Top Ten Tort Claims Adjudicated in FY 2023
- Reversed conviction: Plaintiff was convicted in 1965 of murdering a man in Manhattan. He served over 20 years until being paroled. Plaintiff’s appeals were denied. The convictions stood until a re-investigation in 2020 revealed previously undisclosed records that contained information implicating other suspects (Brady material) and that contradicted the statements of officers who testified at plaintiff’s criminal trial (Rosario material). Upon review, the New York County District Attorney agreed to vacate the conviction 55 years after it was imposed. Settlement of $13.0 million.
- Reversed conviction: Plaintiff was convicted in 1965 of murdering a man in Manhattan. He served 22 years until being paroled. Plaintiff’s appeals were denied. The convictions stood until a re-investigation in 2020 revealed previously undisclosed records that contained information implicating other suspects (Brady material) and that contradicted the statements of officers who testified at plaintiff’s criminal trial (Rosario material). Upon review, the New York County District Attorney agreed to vacate the conviction 55 years after it was imposed. Settlement of $13.0 million.
- Reversed conviction: Plaintiff was convicted in 1992 of murdering a man in Manhattan in 1990. He served over 25 years before demonstrating in 2015 that his confession had been coerced. The key eyewitness was also unable to identify plaintiff. The New York County District Attorney appealed the vacatur but lost and chose to dismiss the indictment in 2017 instead of re-trying the case. Settlement of $12.875 million.
- Police excessive force: Seventeen-year-old plaintiff was rendered a quadriplegic after an encounter with NYPD officers. Plaintiff was present at an altercation and ran when police arrived. During the chase, an officer fell on plaintiff, causing his head to strike the ground and resulting in a severe neck injury. NYPD and EMS personnel then roughly handled plaintiff as he was handcuffed on the ground despite plaintiff’s complaints of loss of feeling in his legs and extremities, which has become permanent. The incident was captured on video. Settlement of $12.0 million.
- Reversed conviction: Plaintiff was convicted in 1989 of murdering a woman in Queens in an MTA warehouse in 1987. He served 27 years before Governor Cuomo commuted his sentence and granted him clemency in 2016. In 2017, the cooperating witness who had testified at plaintiff’s criminal trial recanted his testimony, claiming that NYPD actors coerced and threatened him to implicate plaintiff. Following this recantation, the Queens County District Attorney re-investigated and concluded that co-defendant MTA police committed key Brady violations and joined plaintiff’s motion to vacate his conviction. MTA settled separately from City for $8.5 million. City settlement of $10.0 million.
- Reversed conviction: Plaintiff was convicted in 1993 of a 1992 robbery and murder. He served 27 years before obtaining admissions from the Kings County District Attorney that the handling ADA had failed to turn over Brady and Rosario material, as well as uncovering indicia of police misconduct during the criminal investigation related to manipulating witness identifications. After its review, the Kings County District Attorney dropped its opposition to vacating plaintiff’s conviction in 2020. Settlement of $10.0 million.
- Reversed conviction: Plaintiff was convicted in 1998 of murdering a man in the Bronx in 1996. He served nearly 20 years until an independent news investigation uncovered allegations of witness identification tampering. The Bronx District Attorney re-investigated the case, including plaintiff’s alibi that he was out of state, and agreed to vacate the conviction in 2016 on the basis of ineffective assistance of counsel. The case went to trial and a jury returned a verdict of $5.0 million in 2022. Together with owed interest and attorney fees, total payment of $9,008,545.
- Police excessive force: Plaintiff was allegedly pushed over a guard rail on an embankment over the Cross Bronx Expressway during an on-foot pursuit by an NYPD officer, causing plaintiff to fall 15 feet and land on his head. He sustained a burst cervical disc that rendered him quadriplegic. Plaintiff died four years later. The case went to trial and a jury returned a full liability verdict in 2022. The case settled before the damages phase of trial. Settlement of $8.5 million.
- Medical malpractice: Plaintiffs alleged that H+H failed to properly manage and treat plaintiff mother’s cervical condition, which resulted in amniotic infection and premature birth of the infant plaintiff at 23 weeks. Consequently, infant plaintiff experienced severe and permanent physical and mental issues and requires 24-hour care. The case went to trial and settled during jury deliberations. Settlement of $7.75 million.
- Negligent roadway Design: Decedent died while changing his vehicle’s flat tire on the Harlem River Drive after being struck by a non-City vehicle. Plaintiff claimed negligent roadway design and that the City was on notice of a dangerous condition in the area due to numerous prior similar accidents. Decedent was survived by his wife and two daughters. Settlement of $6.95 million.
Law Claims
Law claims include disputes arising from City contracts, equitable claims, refund claims, City employee salary disputes, special education claims against DOE in which families sue for resources for failure to meet their child’s educational needs, sidewalk assessments, cleanup costs levied on property owners who are in violation of the Mental Hygiene Law, as well as affirmative claims that are brought by the City against individuals, companies, corporations, and other entities for torts, breaches of contract, and as remedies for violations of civil codes.
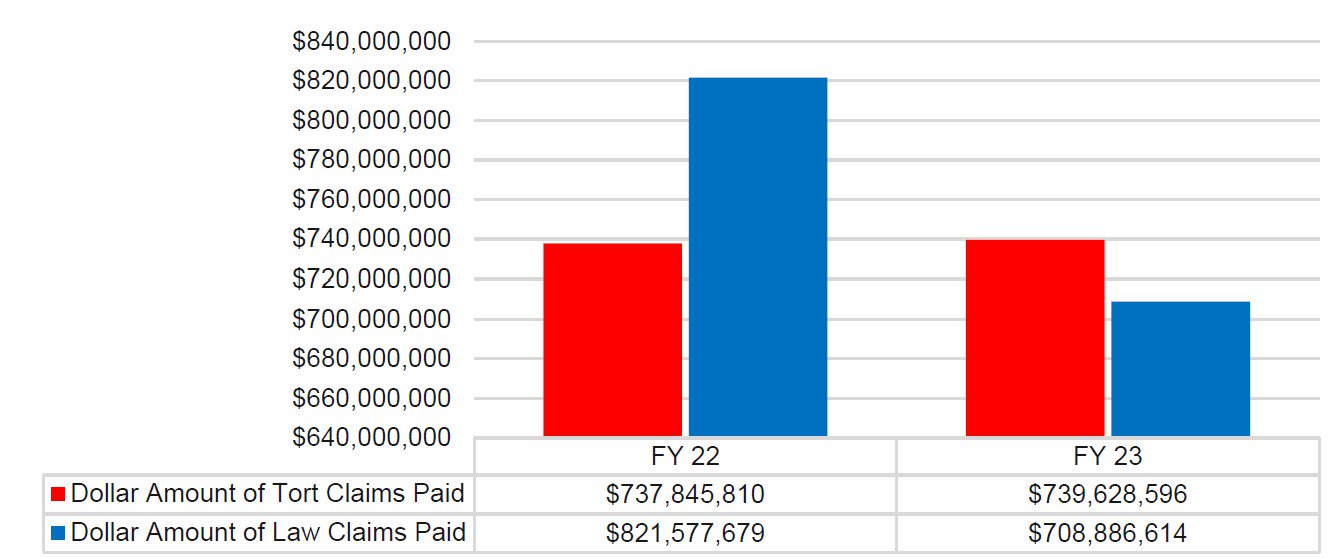
- In FY 2023, the City paid out $708.9 million in law claims, a 14 percent decrease from the $821.6 million paid out in FY 2022.
- The decrease in law claims payouts is driven by $176.7 million less in salary claim payments. This includes decreased payouts on the Gulino class action case from $366.8 million in FY 2022 to $218.8 in FY 2023, a difference of $147.9, and on Fair Labor Standard Act (FLSA) cases from $69.0 million in FY 2022 to $40.8 million in FY 2023.
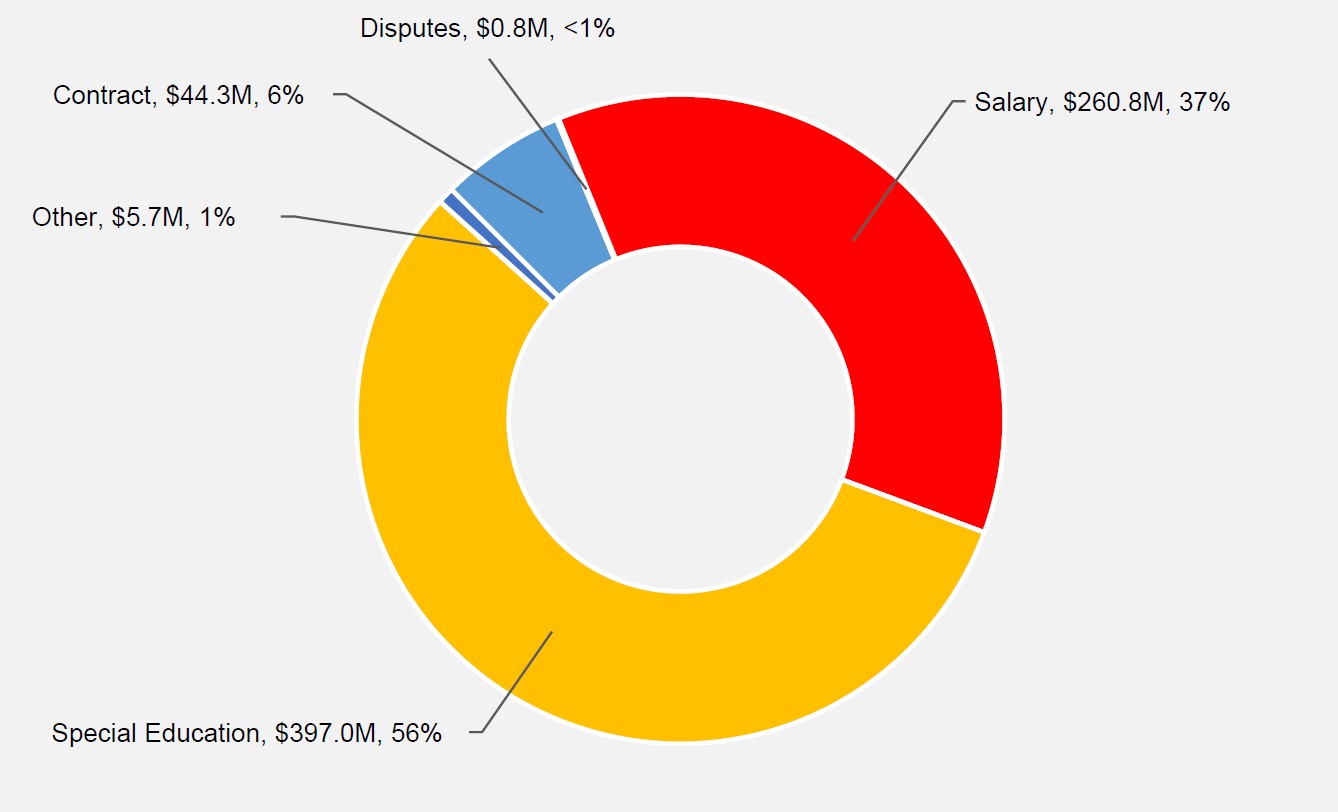
- Eighty-nine percent of all law claim settlements and judgments and 56 percent of law claim payouts in FY 2023 were special education tuition and services reimbursement and attorneys’ fees claims.
Salary Claims
In FY 2023, salary claim settlement and judgment payouts totaled $260.8 million. This includes the $218.8 million in judgments in the Gulino case, a class action filed in 1996 that alleges DOE’s use of two New York State mandated teacher certification examinations had a disparate impact on Black and Latino teachers (discussed in detail on page 47). Excluding judgments on that single class action, payouts on salary claims decreased by $28.8 million or 41 percent in FY 2023. This decrease is attributable to fewer multimillion-dollar payments of collective actions alleging violations of the FLSA, three in FY 2023 down from five in FY 2022.
Special Education Claims
The total settlement amount paid out for special education claims in FY 2023 increased 31 percent to $397.0 million from $303.5 million paid out in FY 2022. As discussed in more detail on page 48 of this report, this increase continues the ten-year trend of increasing payments on special education claims.
Contract Claims
In FY 2023, the settlement of eight delay claims, a subcategory of contract claims in which contractors sue the City for delays on construction projects for which they allege the City bears responsibility, accounted for 73 percent of all contract claims settled. The $43.2 million paid out on these eight delay claim settlements made up 98 percent of the $44.3 million in settlements paid out for all contract claims in FY 2023. Delay claim settlements increased the overall cost to the City on the subject projects by eight percent over the total original contract prices on these eight projects.
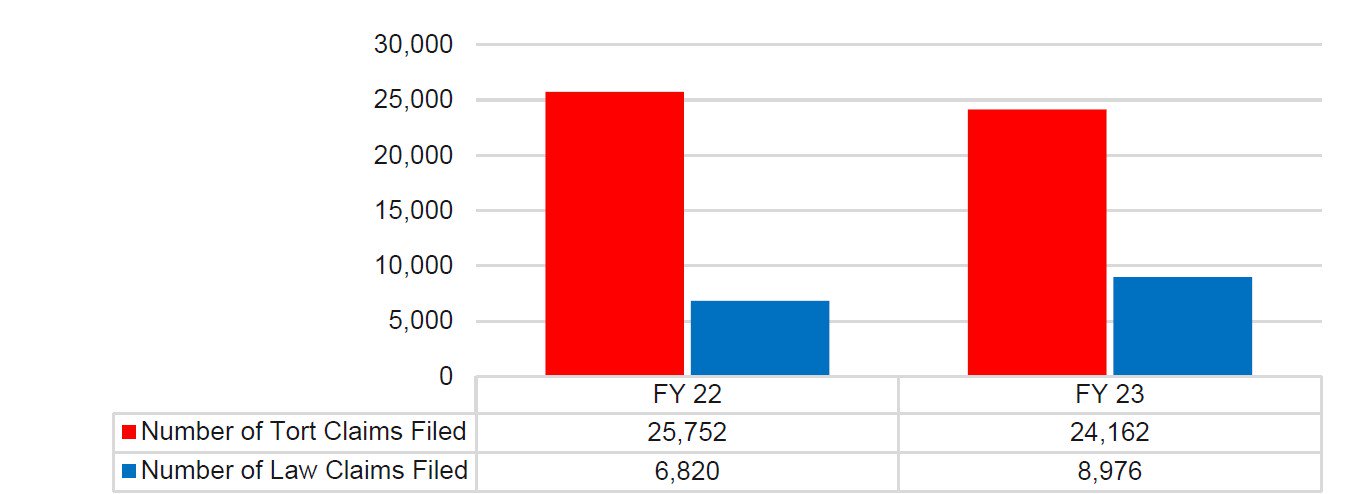
Total Number of Claims Filed, FY 2022 vs. FY 2023
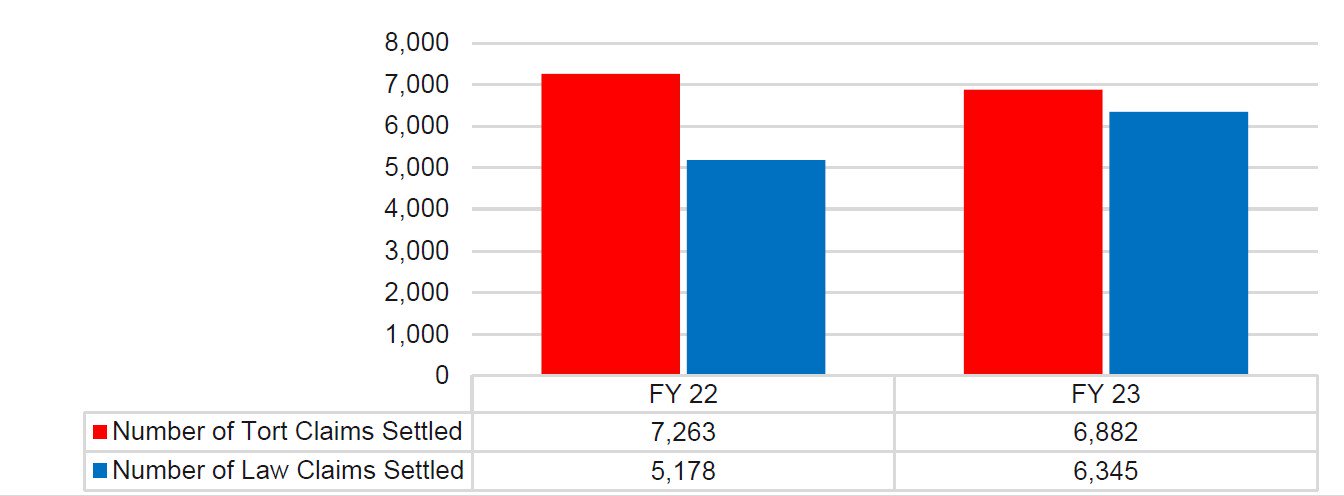
Total Number of Claim Settlements & Judgments, FY 2022 vs. FY 2023
Total Amount of Claim Settlements & Judgments Paid, FY 2022 vs. FY 2023
II. Tort Claims
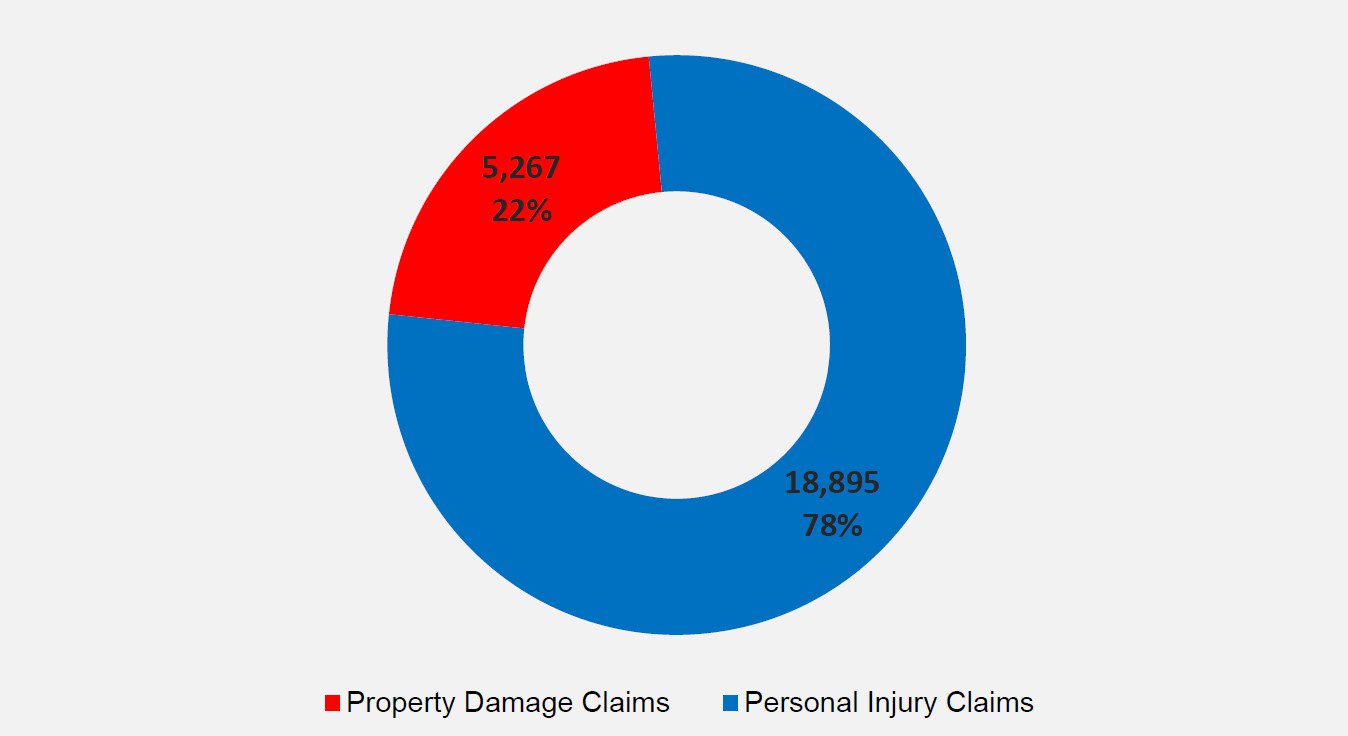
Tort claims consist of personal injury (PI) and property damage (PD) claims.[4] In FY 2023, 24,162 tort claims were filed, a six percent decrease from 25,752 tort claims filed in FY 2022.
Chart 1: Comparison of Tort Claims Filed: Property Damage Claims vs. Personal Injury Claims, FY 2023
In FY 2023, settled tort claims cost the City $739.6 million, an increase from the $737.8 million paid out in FY 2022. Settlements and judgments for tort claims cost each City resident approximately $89.56 in FY 2023.
A. Property Damage Claims
Property damage claims consist of damage or loss to personal and real property as a result of the City’s alleged negligence, including, but not limited to, motor vehicle crashes, roadway conditions, water main breaks, and sewer overflows. The number of property damage claims filed in FY 2023 decreased by 50 percent to 5,267, from the 10,550 claims filed in FY 2022. In FY 2023, there were 1,436 property damage claim settlements, representing 21 percent of all tort claim settlements. Property damage claim settlement payouts decreased by 19 percent in FY 2023 to $6.3 million from $7.8 million in FY 2022. The $6.3 million paid out on property damage claims represented one percent of the total tort claim payouts in FY 2023.
Chart 2: Percentage of Property Damage Claim Settlements & Judgments, Recorded by Claim Type, FY 2023
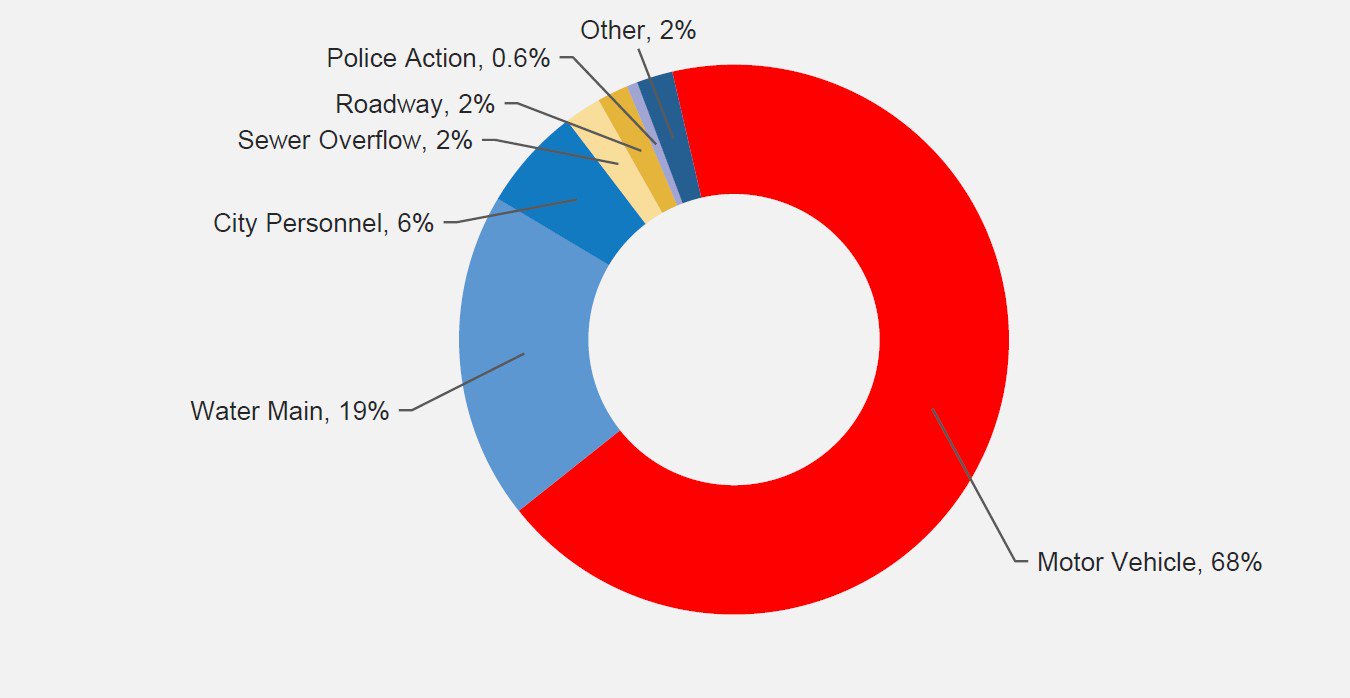
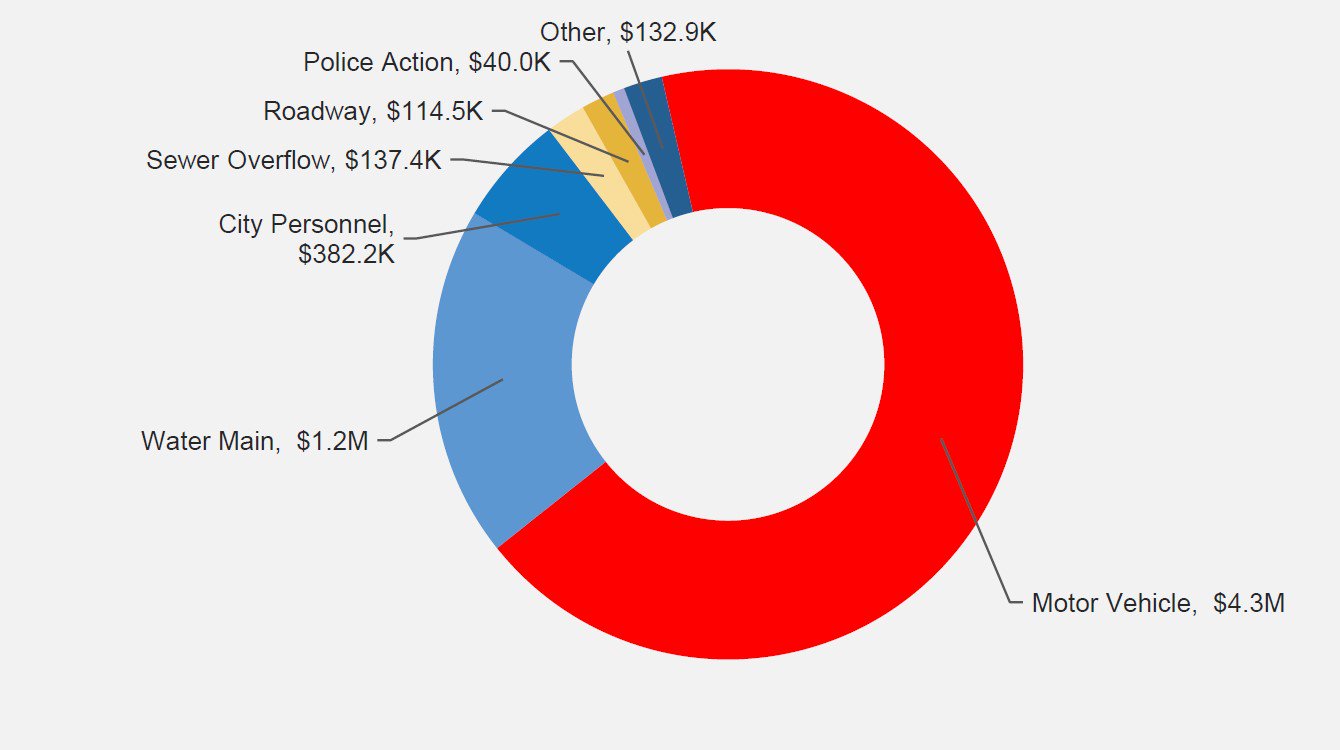
Chart 3: Total Amount Paid Out for Property Damage Claim Settlements & Judgments, Recorded by Claim Type, FY 2023
B. Personal Injury Claims
Personal injury claims are the most frequently filed and the costliest claims for the City to resolve. These claims include, but are not limited to, allegations of medical malpractice, civil rights violations, injuries occurring on the premises of DOE schools, motor vehicle crashes involving City-owned vehicles, defective sidewalks, and unlawful actions of the police or uniformed services employees. In FY 2023, there were 18,895 personal injury claims filed, a 24 percent increase from the 15,202 personal injury claims filed in FY 2022. In FY 2023, personal injury claims accounted for $733.3 million, or 99 percent, of the $739.6 million paid out on all settled tort claims. The average settlement and judgment cost of a personal injury claim in FY 2023 was $134,656, five percent higher than the FY 2022 average of $128,649. However, the median settlement for all personal injury claim settlements was $15,000 in FY 2023 compared to $18,000 in FY 2022 and $20,000 in FY 2021, or 20 percent and 33 percent decreases, respectively.
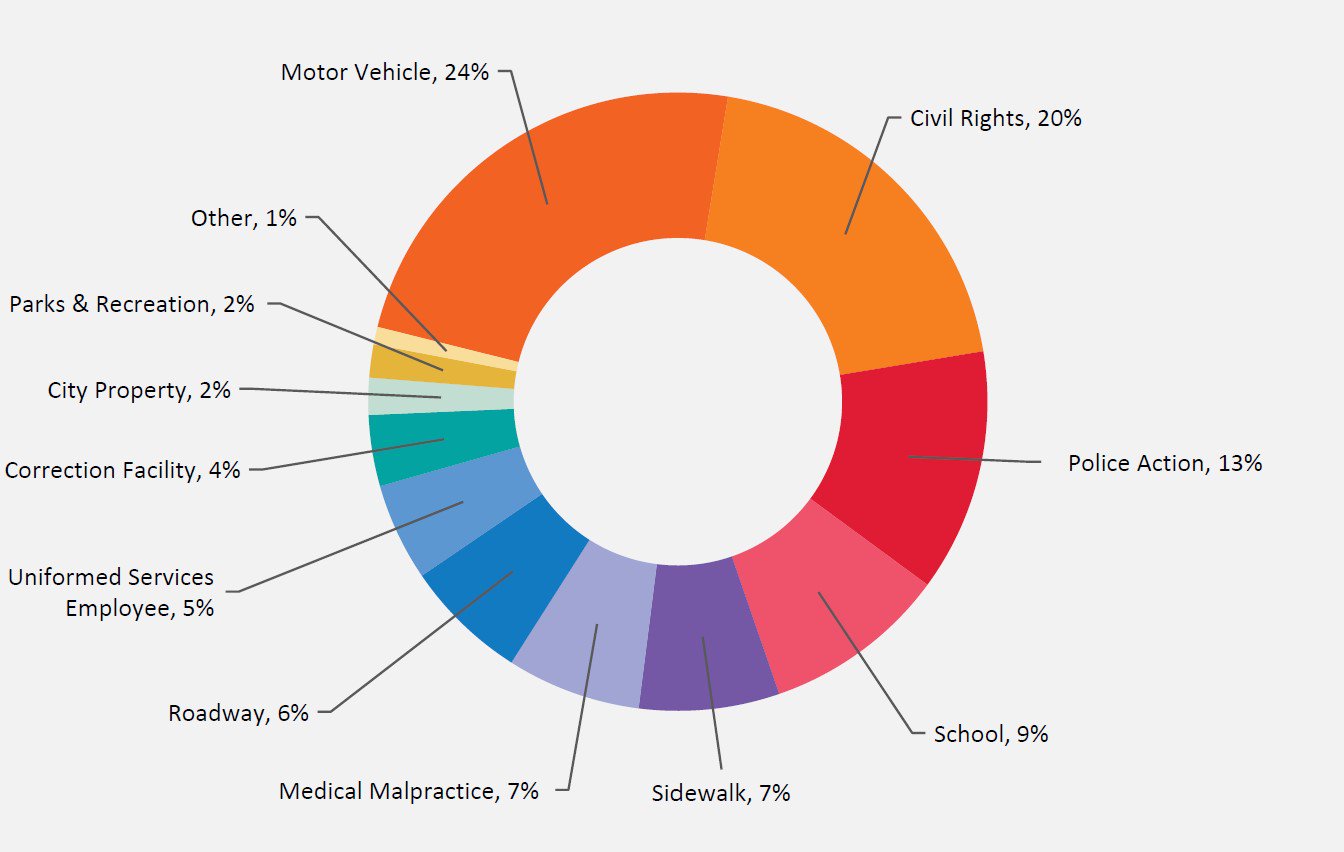
Chart 4: Percentage of Personal Injury Claim Settlements & Judgments, Recorded by Claim Type, FY 2023
C. Personal Injury Claim Trends by Claim Type
In FY 2023, the five most frequently filed personal injury claim types were police action claims (5,092), correction facility claims (4,118), sidewalk claims (2,350), motor vehicle claims (1,693), and civil rights claims (1,450). The five costliest personal injury claim settlements in FY 2023 by claim type were motor vehicle claims ($173.7 million), civil rights claims ($145.4 million), police action claims ($93.1 million), school accident claims ($70.6 million), and sidewalk claims ($53.5 million). Together, in FY 2023, these five claim type settlements cost $536.2 million and accounted for 73 percent of all personal injury claim settlements.
Chart 5: Total Amount Paid Out for Personal Injury Claim Settlements & Judgments Recorded by Claim Type, FY 2023
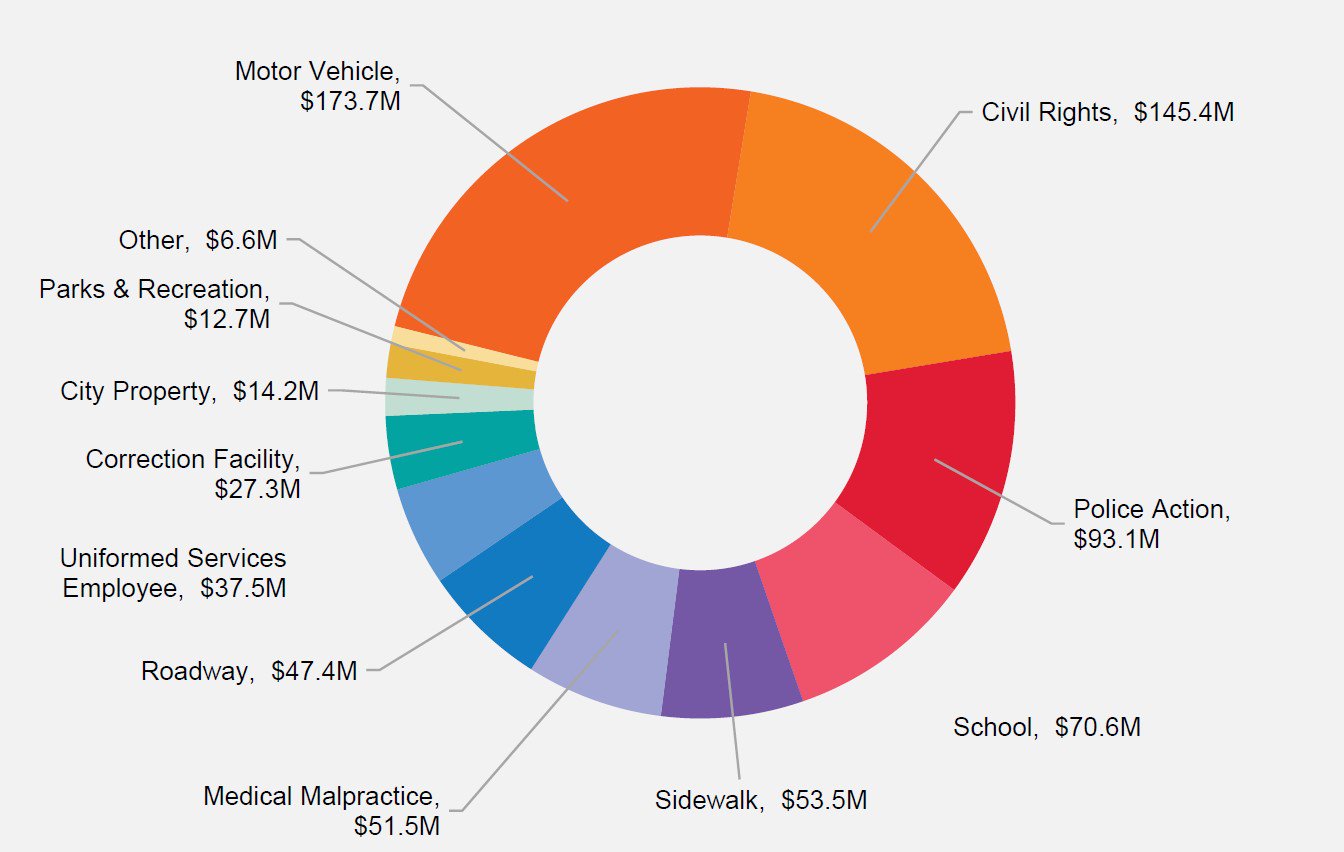
Out of the 5,446 personal injury claim settlements, there were 139 personal injury claim payouts for one million dollars or more, accounting for $365.3 million paid out in FY 2023. These 139 claims with payouts for one million dollars or more represent 50 percent of the total personal injury claim settlements paid out in FY 2023. The top five claim payouts of one million dollars or more by claim type are motor vehicle claims ($106.1 million), civil rights claims ($101.5 million), medical malpractice claims ($40.3 million), school accident claims ($27.1 million), and police action claims ($24.5 million). These five claim types represent 82 percent of the total $365.3 million paid out on personal injury claim settlements of one million dollars or more.
1. Civil Rights Claims
Civil rights claims typically arise from alleged statutory or constitutional violations such as discrimination based on sex/gender, race, religion, disability, or age. Claims in this category also include alleged constitutional civil rights violations by law enforcement personnel such as false arrest, malicious prosecution, excessive force, or reversed conviction claims litigated under 42 U.S.C. § 1983 in federal court.[5]
Civil rights claims decreased three percent to 1,450 claims filed in FY 2023, compared to 1,500 filed in FY 2022, and down 51 percent from the 2,937 claims filed in FY 2014. The cost of civil rights claim payouts increased to $145.4 million in FY 2023 up from $144.0 million in FY 2022, a one percent increase. Civil rights payouts are expected to increase in FY 2024 following the recent resolution of several federal class actions involving both NYPD and the Department of Correction (DOC) in addition to numerous reversed conviction actions currently pending.
Chart 6: Civil Rights Claims Filed and Settled, FYs 2014–2023[6]

In FY 2023, 18 of the 139 personal injury claims that resolved for one million dollars or more were civil rights claims, totaling $101.5 million, or 70 percent of the total civil rights claim payouts. Thirteen of the 18 civil rights claims resolved for one million dollars or more involved the NYPD, and three involved the DOC.
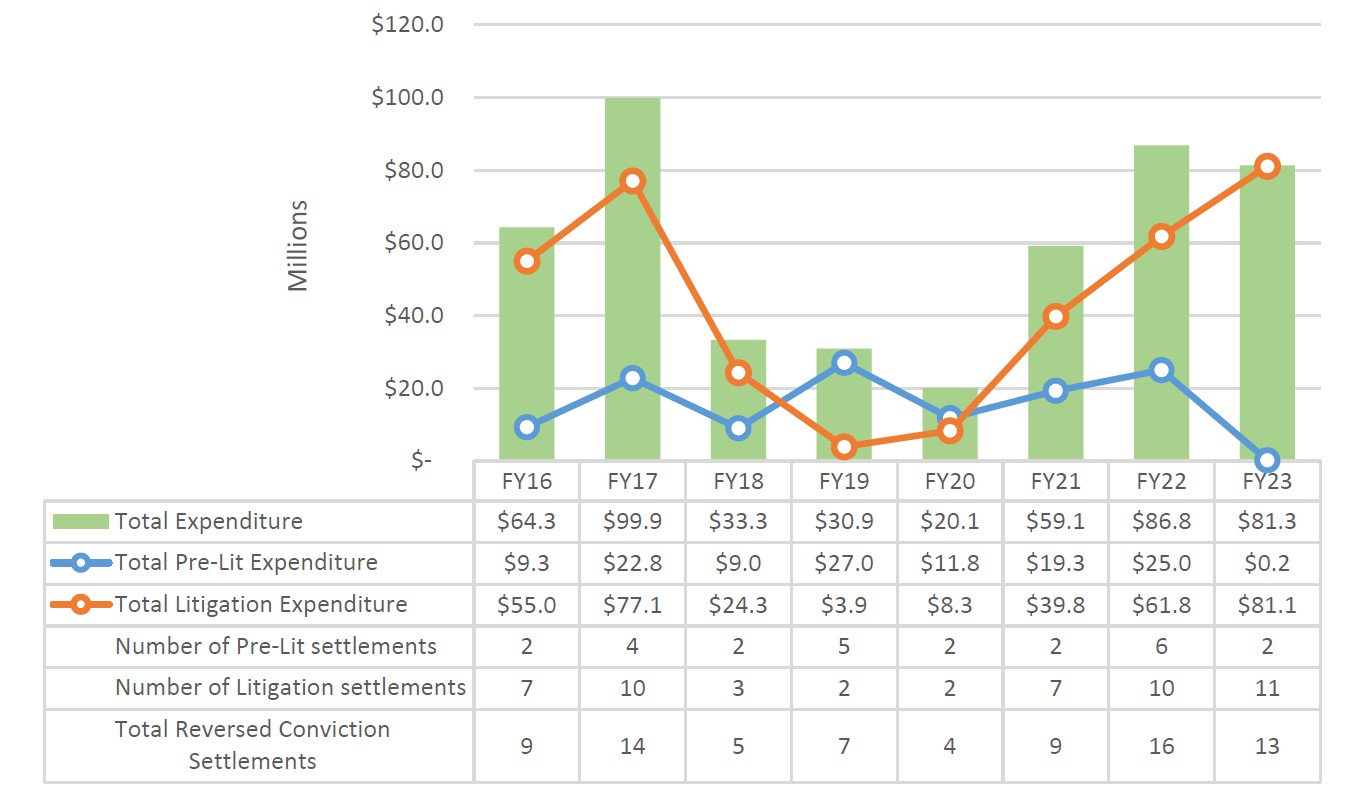
In FY 2023, the City resolved thirteen reversed conviction matters. These 13 matters cost the City $81.3 million, or 56 percent of the total civil rights claim payouts, while representing only 2.8 percent of the total number of civil rights matters resolved. In FY 2022, the City resolved 16 reversed conviction claims at a total cost of $86.8 million, which represented 3.5 percent of all claims resolved and 61 percent of the total civil rights claim payouts. These figures demonstrate the high exposure the City faces from reverse conviction claims and lawsuits that will continue to arise as District Attorneys review of past cases.
Of the thirteen reversed conviction matters resolved in FY 2023, the Comptroller’s Office resolved two claims pre-litigation. Such settlements save the City’s legal resources and reduces the judiciary’s case burden. BLA strives to resolve claims that have clear and substantial supporting evidence from the criminal trial and subsequent judicial review, so that claimants do not endure yet another judicial proceeding to find some measure of justice. As demonstrated in the chart below and in Appendix C reversed conviction claims settled pre-litigation generally resolve for less than reversed conviction claims that resolve during litigation.
Table 1: Reversed Conviction Settlements, FY 2023
(*indicates pre-litigation settlements; ** indicates post-verdict; resolutions from prior years can be found in Appendix C)
| FY 2023 | ||
|---|---|---|
| Name | Years Incarcerated | Settlement |
| Muhammad Aziz | 20.25 years (1965-1985) | $13 million |
| Khalil Islam | 22 years (1965-1987) | $13 million |
| Johnny Hincapie | 25 years (1990-2015) | $12.875 million |
| Felipe Rodriguez | 27 years (1990-2017) | $10 million |
| Emmanuel Cooper | 27 years (1993-2030) | $10 million |
| Richard Rosario** | 19.75 years (1996-2016) | $9 million |
| Austin Babb | 9.5 years (2010-2020) | $3.95 million |
| Jawaun Fraser** | 2.1 years (2016-2018) | $3.675 million |
| Robert Majors | 10 years (2001-2011) | $3.3 million |
| Shomari Laviscount | 5.5 years (2008-2014) | $1.5 million |
| Antoine Weeks | 3.5 years (2016-2020) | $750,000 |
| Desmond Laverpool* | 2 years (2016-2018) | $183,000 |
| John Maglione* | 2 years (2017-2019) | $30,000 |
| TOTAL | 175.6 | $81.3 million |
Chart 7: Reversed Conviction Payouts, FYs 2016–2023
2. Motor Vehicle Claims
Personal injury motor vehicle claims involve alleged motor vehicle crashes with City-owned fleet vehicles. There were 1,693 personal injury motor vehicle claims filed in FY 2023, up 14 percent from FY 2022 when 1,480 personal injury motor vehicle claims were filed. In FY 2023, personal injury motor vehicle claim settlements cost $173.7 million, a 23 percent increase, compared to $141.1 million paid out to resolve motor vehicle claims in FY 2022. The number of personal injury motor vehicle claim settlements increased by two percent to 563 in FY 2023 from 554 in FY 2022.
Chart 8: Personal Injury Motor Vehicle Claims Filed and Settled, FYs 2014–2023
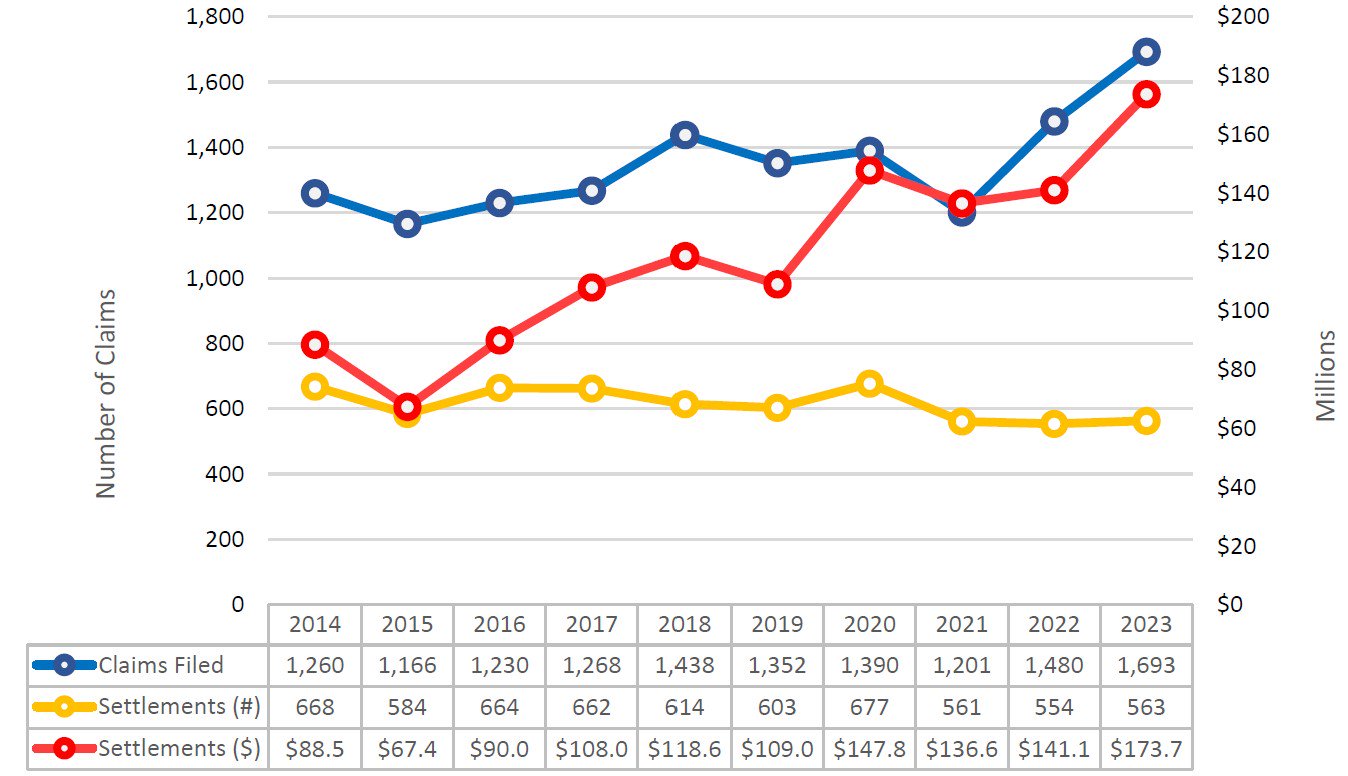
In FY 2023, 58 of the 139 personal injury claims resolved for one million dollars or more were motor vehicle claim payouts, totaling $106.1 million—61 percent of all FY 2023 personal injury motor vehicle claim settlement payments. New York City Fire Department (FDNY) claim settlement payouts increased to $45.8 million in FY 2023, up from $25.9 million in FY 2022, a 77 percent increase. Notably, of the $45.8 million paid in FY 2023, 89 percent or $40.6 million in FDNY claim settlement payments were attributed to motor vehicle personal injury claims.
FY 2023 payouts on motor vehicle claims were the highest on record since FY 2000 and show a continued trend of increasing personal injury motor vehicle payouts since FY 2015. There has been a 158 percent increase in total personal injury motor vehicle claim payouts since FY 2015 when $67.4 million was paid out. FY 2023 is the seventh consecutive fiscal year in which personal injury motor vehicle claim settlements topped $100 million. Furthermore, the average payout per motor vehicle personal injury claim settlement increased from $115,326 in FY 2015 to $308,441 in FY 2023, a 167 percent increase. In FY 2023, the median settlement for all settlements of personal injury motor vehicle claims was $65,000.
Additional analysis of motor vehicle claims against the City over the past decade, along with recommendations to reduce them, are available in a February 2023 report by the Comptroller’s Office Bureau of Policy and Organizing, “Wreckless Spending: The Accelerating Cost of City Car Crash Settlements.” The report identifies a series of recommendations to reduce claims resulting from severe crashes by implementing emerging fleet safety initiatives, reducing the number and size of vehicles in the City fleet, improving street design, and enhancing accountability for both City drivers and agencies.
3. Police Action Claims
Personal injury police action claims include allegations of improper police conduct, such as false arrest or imprisonment, or excessive force. In FY 2023, personal injury police action claims were the most frequently filed personal injury claim type and accounted for the third highest claim type payout. Personal injury police action claim filings increased in FY 2023 to 5,092 claims from 2,902 claims filed in FY 2022, a 75 percent increase. The 5,092 claims filed in FY 2023 represents the highest number of police action claims filed since FY 2014, when the number of personal injury police action claims filed peaked at 5,642. Personal injury police action claim settlements in FY 2023 increased by 29 percent, to $93.1 million from $72.0 million paid out in FY 2022. Since the peak in FY 2017, when police action claim payouts totaled $163.8 million, in FY 2023 personal injury police action claim settlements have decreased 43 percent.
Chart 9: Personal Injury Police Action Claims Filed and Settled, FYs 2014–2023

The Comptroller’s Office dedicates significant resources to investigating, evaluating, and, if appropriate, resolving certain personal injury police action claims prior to litigation. The following chart illustrates the results of the substantial effort to resolve personal injury police action claims pre-litigation.
Table 2: Personal Injury Police Action Claim Pre-litigation and Litigation Settlements, FYs 2019-2023
| Fiscal Year | Police Action Claims (PI) Resolved (total, including Litigation) | Police Action Claims (PI) Resolved (Pre-litigation) | Resolved Pre-litigation
(Percent) |
Total Police Action (PI) Claim Payout (in millions) | Total Police Action (PI) Claim Payout (Pre-litigation) (in millions) | Total Police Action (PI) Payout Pre-Litigation (Percent) |
|---|---|---|---|---|---|---|
| 2019 | 2,338 | 1,320 | 56% | $98.3 | $21.7 | 22% |
| 2020 | 2,455 | 1,219 | 50% | $85.6 | $20.2 | 24% |
| 2021 | 1,757 | 958 | 55% | $78.5 | $18.2 | 23% |
| 2022 | 2,059 | 1,235 | 60% | $72.0 | $22.1 | 31% |
| 2023 | 2,031 | 1,208 | 59% | $93.1 | $22.4 | 24% |
| TOTAL | 10,640 | 5,940 | 56% | $427.5 | $104.6 | 24% |
The Comptroller’s Office pre-litigation settlements resulted in the resolution of 56 percent of all resolved personal injury police action claims over the last five fiscal years. That significant percentage of claims resolved before litigation, however, represents only 24 percent of the total cost of personal injury police action claim payouts over the same time period. The average cost of personal injury police action claims settled pre-litigation was $17,609, while the average cost of personal injury police action claims resolved in litigation over the last five fiscal years was $68,702.
4. Medical Malpractice Claims
Medical malpractice claims result from alleged improper diagnosis, treatment, or care and are typically filed against NYC Health + Hospital (H+H) facilities. Since medical malpractice claims are complex, the cases often take five to ten years to resolve. The number of claims filed is, therefore, a better indicator of medical malpractice claims activity than the dollar amount paid out in any single year. In FY 2023, there were 398 medical malpractice claims filed, down 10 percent from the 441 medical malpractice claims filed in FY 2022, and down 37 percent from the 629 claims filed in FY 2015. The 64 medical malpractice claims resolved in FY 2023 cost the City $51.5 million, compared to $81.1 million paid out on 103 medical malpractice claims settled in FY 2022.
Chart 10: Medical Malpractice Claims Filed and Settled, FYs 2014–2023

Settlements of medical malpractice claims accounted for seven percent of the total $733.3 million paid out for all personal injury claims resolved in FY 2023. Of the 139 personal injury claims resolved for one million dollars or more in FY 2023, 14 were medical malpractice claim payouts, totaling $40.3 million.
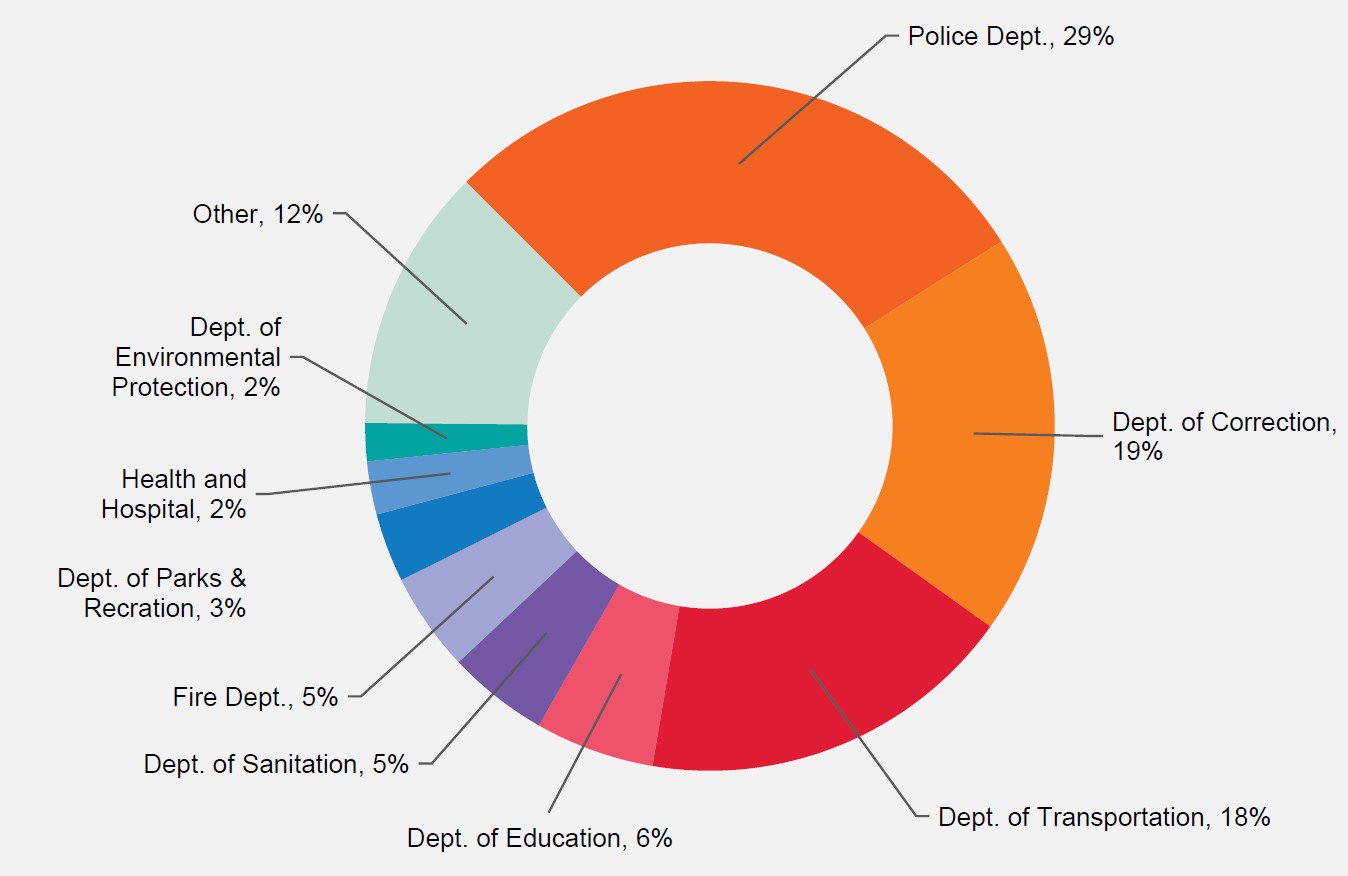
D. Tort Claim Trends by Agency
In FY 2023, the five agencies that accounted for the highest number of tort claims filed were NYPD (6,891 claims), (DOC) (4,559), Department of Transportation (DOT) (4,296), DOE (1,352), and Department of Sanitation (DSNY) (1,144).
Chart 11: Percentage of Tort Claims Filed by Agency,[7] FY 2023
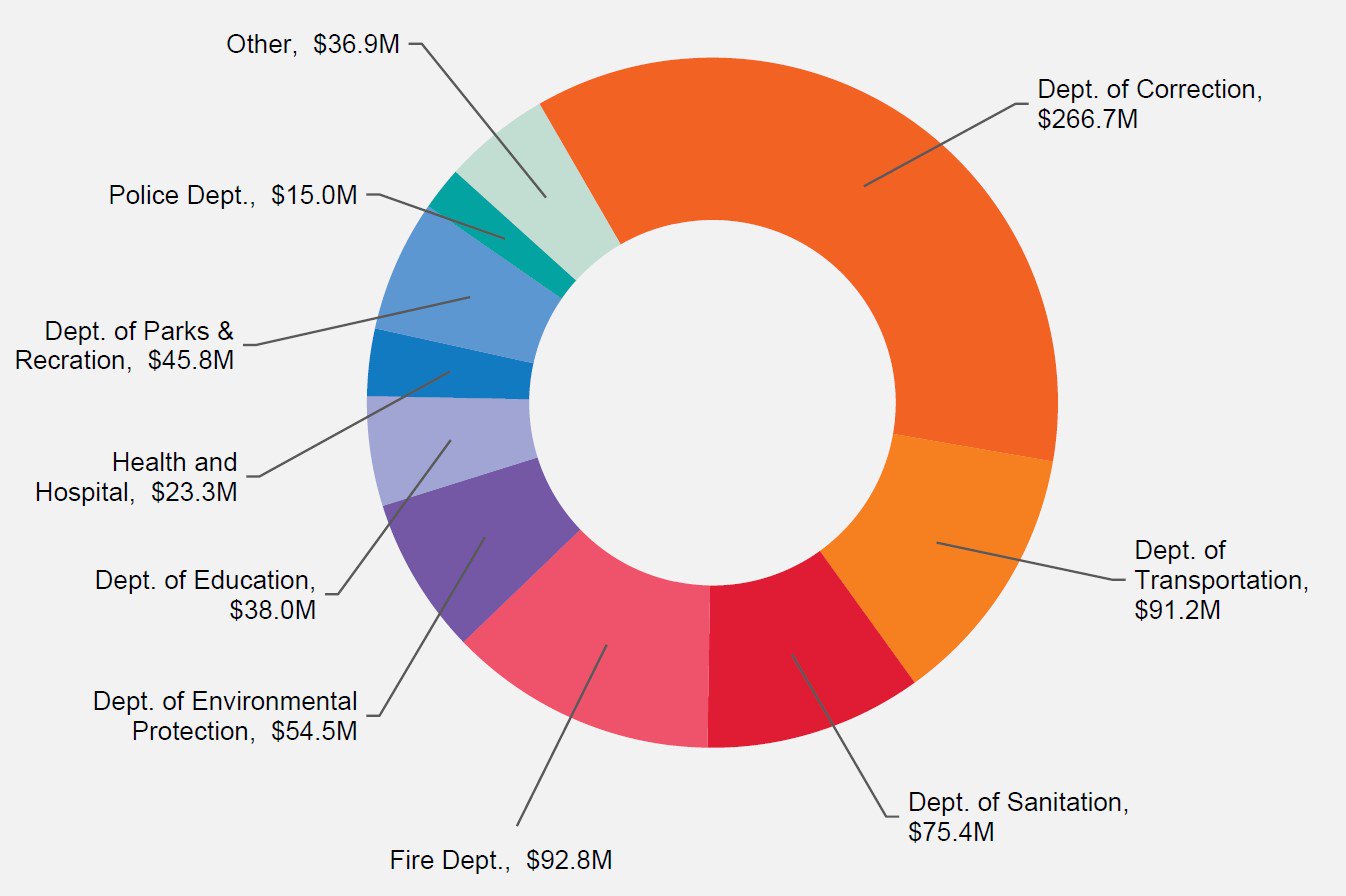
The five agencies with the highest tort claim settlement and judgment costs in FY 2023 were the NYPD ($266.7 million), DOE ($92.8 million), DOT ($91.2 million), DSNY ($75.4 million), and H+H ($54.5 million).
Chart 12: Tort Claim Settlement Costs by Agency, FY 2023
1. New York City Police Department
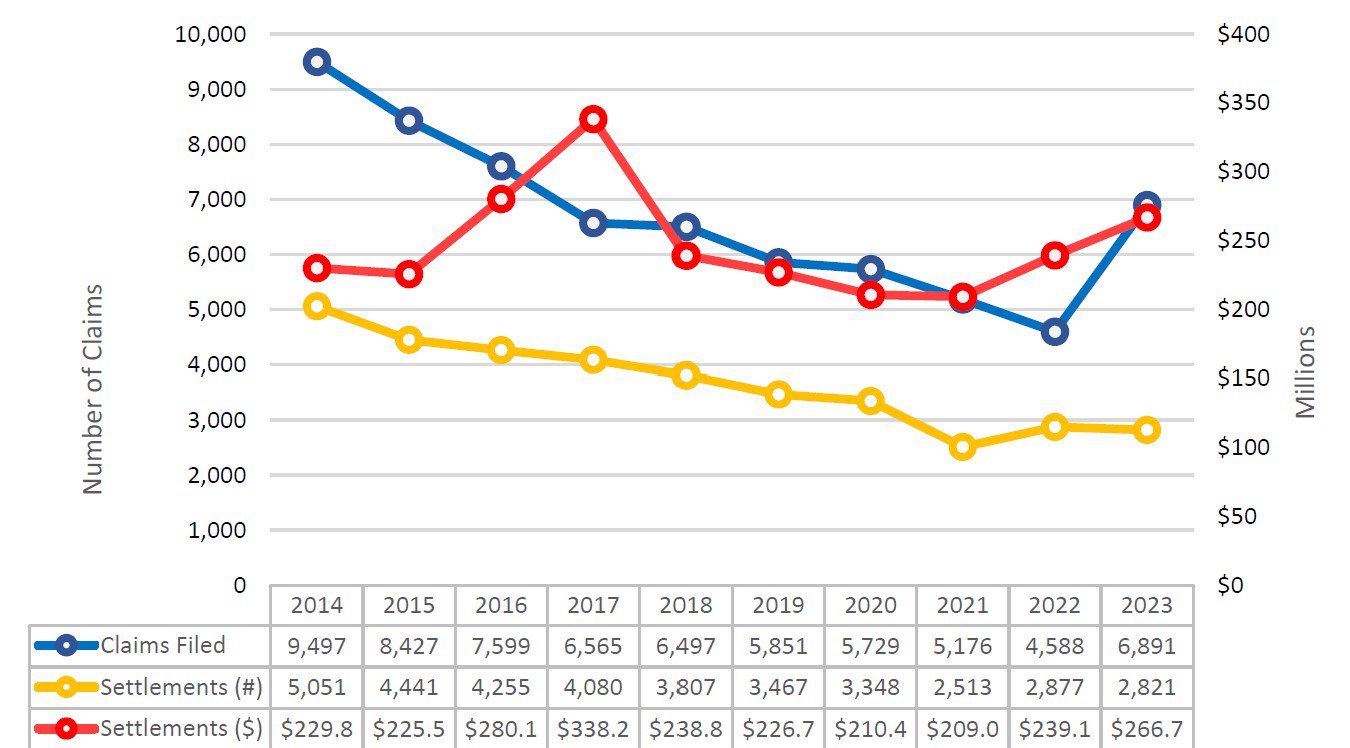
Tort claims against the NYPD include, but are not limited to, allegations of excessive force, civil rights violations, and personal injury or property damage arising out of motor vehicle crashes involving police vehicles. In FY 2023, the number of tort claims filed against the NYPD increased to 6,891 from 4,588 filed in FY 2022, representing a 50 percent increase. FY 2023 represents the first year that claims filed against the NYPD have increased since FY 2014 when 9,497 claims were filed.
Chart 13: Number and Percentage of NYPD Tort Claims Filed by Claim Type, FY 2023
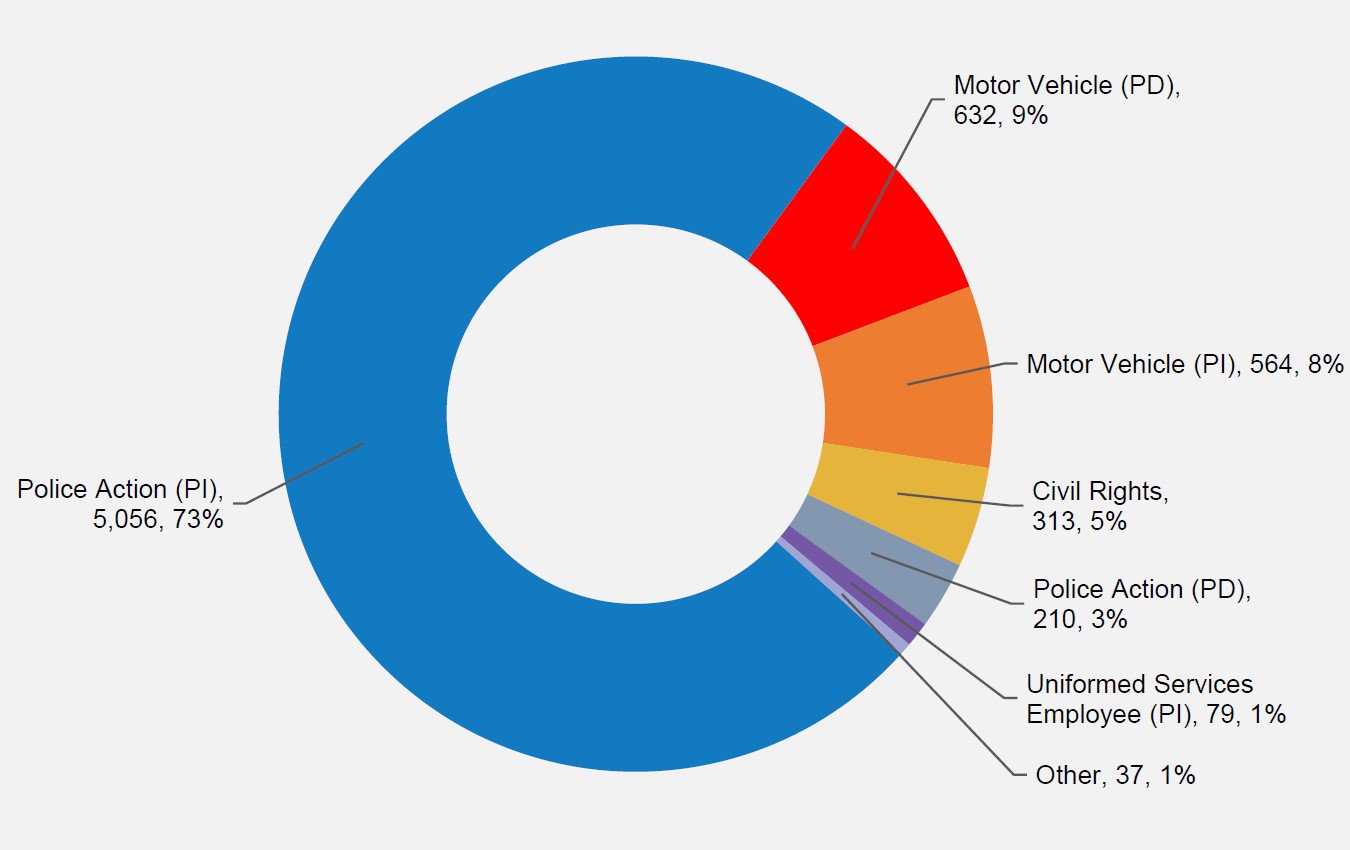
Claims against the NYPD that settled in FY 2023 cost the City $266.7 million, compared to $239.1 million in FY 2022, a 12 percent increase. However, this is a 21 percent decrease from the FY 2017 high when $338.2 million was paid out on NYPD claims.
Chart 14: NYPD Tort Claims Filed and Settled, FYs 2014–2023
The 12 percent increase in payments compared to FY 2022 is attributable to the continued resolution of claims and lawsuits that arose out of protest related activity from 2020-2021throughout New York City in response to George Floyd’s death, and a steady number of costly reversed conviction resolutions (see Table 6).[8]
NYPD claims accounted for 36 percent of the total overall cost of resolved FY 2023 tort claim payouts. NYPD settlement costs were the highest among all City agencies in FY 2023. The NYPD should take additional steps to reduce misconduct claims, including by incorporating information on claims against officers into its accountability framework and adopting additional policies and trainings designed to reduce officer misconduct.
We anticipate that NYPD expenditure will remain high in FY 2024. Reversed conviction claim filings continue as District Attorney’s offices have increased efforts to review past convictions. While the thirteen reversed conviction claims resolved in FY 2023 represent less than one percent of all NYPD claims resolved, the total settlements of $81.3 million amount to 30 percent of the total NYPD payout in FY 2023. This continues the trend of a small number of reversed conviction settlements constituting a large percentage of NYPD claim payouts, as illustrated in the table below. Moreover, we anticipate the recent resolution of certain class actions involving NYPD will also contribute to sustained higher expenditures in the future.
Table 3: Reversed Conviction Claims, FYs 2016–2023
| Fiscal Year | Major Reversed Conviction Claims Resolved (Pre-litigation and Litigation) | Total Cost | NYPD Claims Total Settled (Tort) | NYPD Claims Total Payout (Tort) | Reversed Conviction Percent of Total NYPD Tort Claims Settled | Reversed Conviction Percent of Total NYPD Tort Claim Payouts |
|---|---|---|---|---|---|---|
| 2016 | 9 | $64.3M | 4,255 | $280.1M | 0.21% | 22.96% |
| 2017 | 14 | $99.93M | 4,080 | $338.2M | 0.34% | 29.55% |
| 2018 | 5 | $33.25M | 3,807 | $238.8M | 0.13% | 13.92% |
| 2019 | 7 | $30.93M | 3,467 | $226.7M | 0.20% | 13.64% |
| 2020 | 4 | $20.3M | 3,348 | $210.4M | 0.12% | 9.65% |
| 2021 | 9 | $59.02M | 2,513 | $209.0M | 0.36% | 28.24% |
| 2022 | 16 | $86.8M | 2,877 | $239.1M | 0.56% | 36.30% |
| 2023 | 13 | $81.3M | 2,821 | $266.7M | 0.46% | 30.48% |
| TOTAL | 77 | $475.83M | 27,168 | $2,009.0M | 0.28% | 23.68% |
2. Department of Education
Claims against the DOE include, but are not limited to, negligent supervision, general premises liability, and intentional sexual assault (matters revived by the Child Victim’s Act (CVA)).[9] In FY 2023, there were 1,352 DOE claims filed compared to 1,153 in FY 2022, a 17 percent increase, and up 160 percent from 521 claims filed in FY 2021 when schools shifted to remote learning due to COVID-19 concerns. DOE claim settlement payouts increased to $92.8 million in FY 2023, up from $82.6 million in FY 2022, a 12 percent increase.
Chart 15: DOE Tort Claims Filed and Settled, FYs 2014–2023
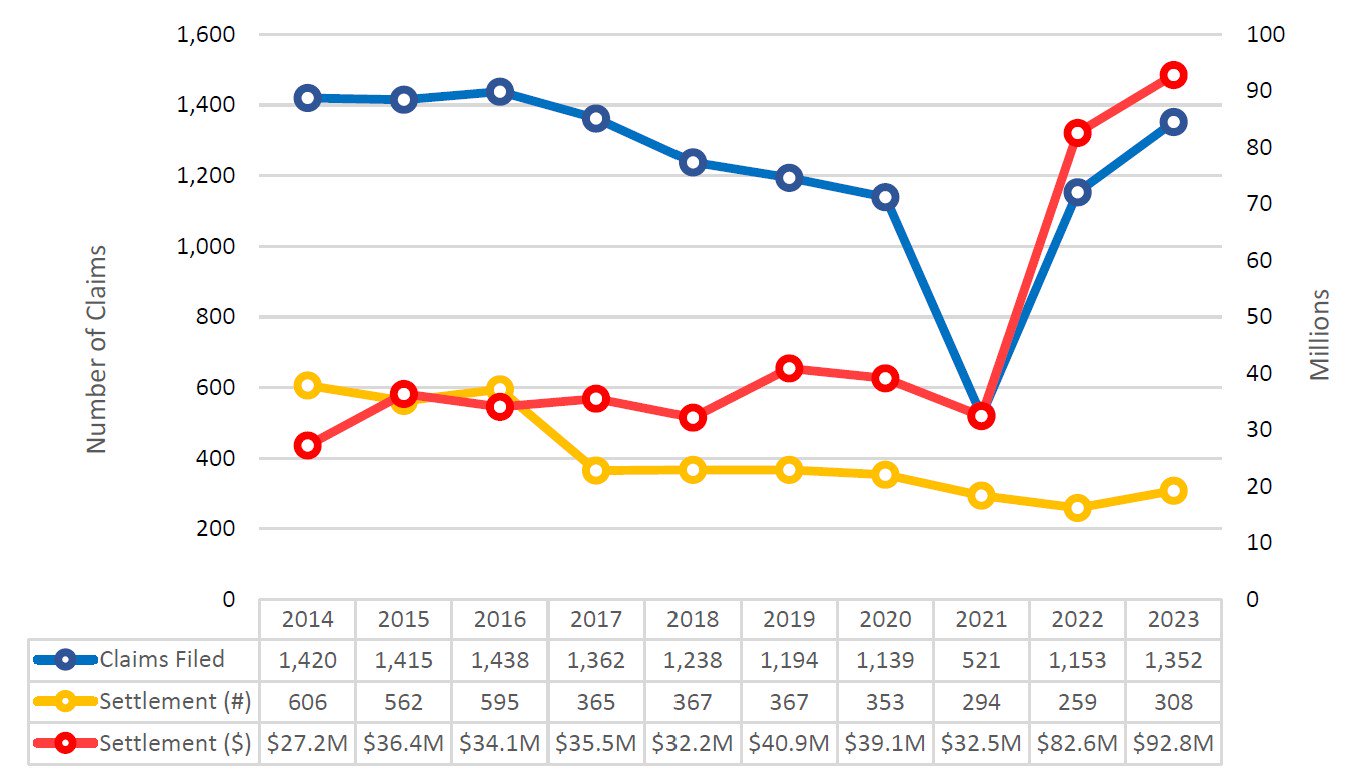
The number of settlements involving DOE increased to 308 claims from 259 claims, or a 19 percent increase, from FY 2023 to FY 2022. The $92.8 million paid out on DOE claims in FY 2023 represented the highest ever paid out on DOE tort claims. This is settlement high is primarily due to the resolution of the earliest CVA cases. We expect expenditures on DOE cases to increase as additional CVA cases are resolved.
3. Department of Transportation
Claims against the DOT generally involve, but are not limited to, allegations of improper sidewalk or roadway maintenance, roadway design claims, and motor vehicle crashes involving DOT vehicles. In FY 2023, 4,296 claims were filed against DOT, compared to 4,345 in FY 2022, a one percent decrease. The settlement amount for DOT claims in FY 2023 decreased to $91.2 million, down from $105.8 million in FY 2022, a 14 percent decrease.
Chart 16: DOT Tort Claims Filed and Settled, FYs 2014–2023

The number of DOT claim settlements decreased to 845 in FY 2023, compared to 890 DOT claims resolved in FY 2022, a five percent decrease. However, the data indicates that the average cost per DOT claim settlement has increased since FY 2016, when the average cost per DOT claim settlement was $58,959. In FY 2023, the average cost to settle a DOT claim increased from FY 2016 by 83 percent to $107,981. In FY 2023, the median settlement for all DOT settlements was $30,000.
4. Department of Sanitation
Claims against the DSNY include, but are not limited to, motor vehicle crashes involving DSNY vehicles (for both personal injury and property damage) and employee workplace accident claims. In FY 2023, there were 1,144 claims filed compared to 1,415 in FY 2022, a 19 percent decrease, and down 53 percent from a high of 2,412 in FY 2014. DSNY claim settlement payouts increased to $75.4 million in FY 2023, down from $85.3 million in FY 2022, a 12 percent decrease.
Chart 17: DSNY Tort Claims Filed and Settled, FYs 2014–2023

The number of settlements involving DSNY decreased by 119 claims, or 17 percent, from FY 2023 to FY 2022. Still, the number of claim settlements against DSNY in FY 2023 is down 58 percent from FY 2014, when 1,426 claims against DSNY were settled. However, there has been an increase in average cost in DSNY claim settlements that can be attributed to severe injuries associated with crashes involving DSNY heavy equipment and trucks, as well as the economic damages associated with loss of income and pension for DSNY employees injured on the job (known as uniformed services employee claims[10]), resulting in higher settlement payouts in FY 2023. The average DSNY claim settlement cost in FY 2023 was $126,273, up 380 percent from FY 2015, when the average DSNY claim settlement cost $26,254. In FY 2023, the median settlement for all DSNY personal injury settlements was $100,000.
5. NYC Health + Hospitals
Claims against NYC Health + Hospitals (H+H) encompass claims for personal injuries including alleged medical malpractice, “slip and falls” on hospital property, and property damage sustained on hospital property. Many medical malpractice claims typically resolve in five to ten years from the date of filing, so the number of claims filed against H+H in a given year is a better indicator of current H+H claim trends than the amount paid out in any one year.
In FY 2023, 600 claims were filed against H+H, down from 637 claims filed in FY 2022, a six percent decrease. The amount paid out on H+H claims decreased to $54.5 million in FY 2023, down from $82.7 million in FY 2022, a 34 percent decline.
Chart 18: H+H Tort Claims Filed and Settled, FYs 2013–2023
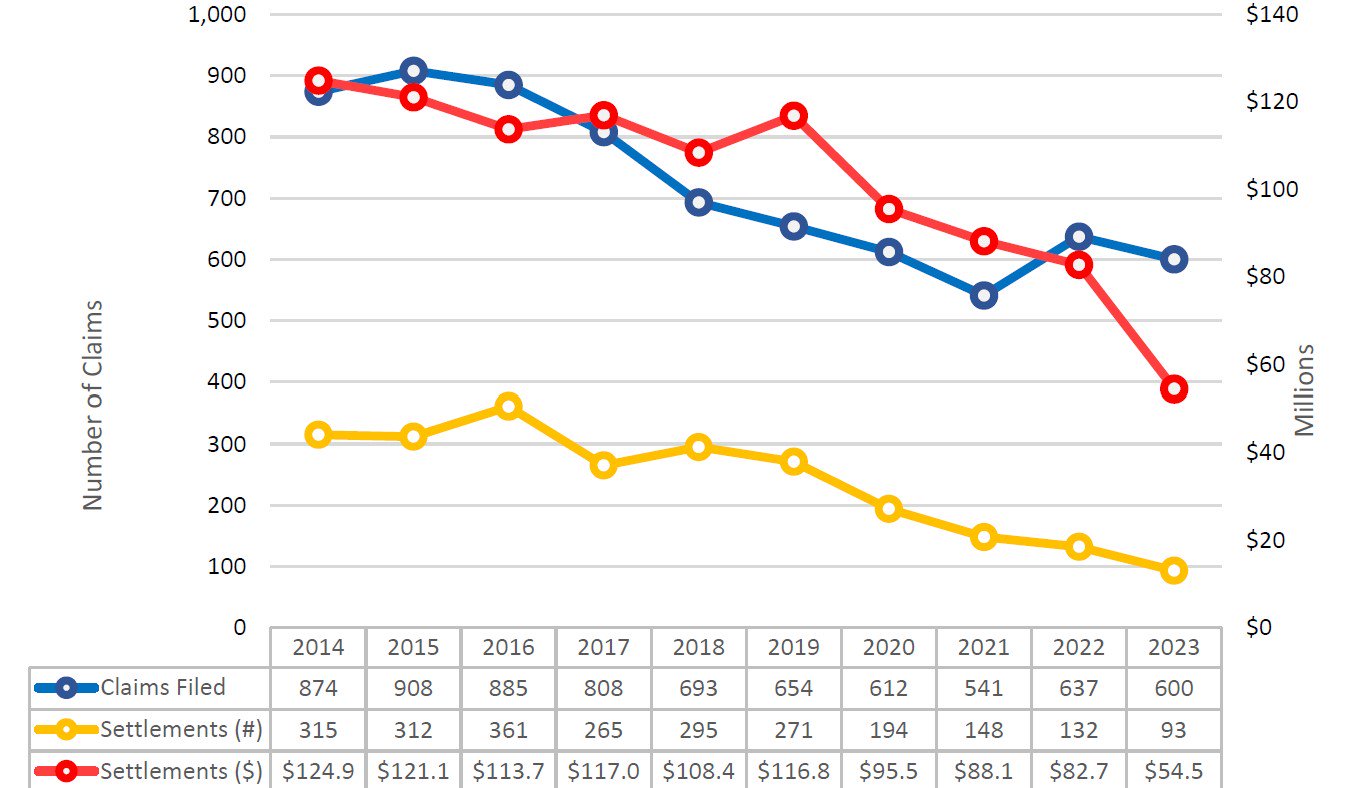
Of the 600 claims filed against H+H in FY 2023, there were 398 medical malpractice claims filed, accounting for 66 percent of all H+H claims. H+H claims constituted one percent of the total number of tort claims resolved in FY 2023, but accounted for the fifth highest tort expenditure at $54.5 million, or seven percent of the total amount paid for settled tort claims in FY 2023.
Notably, the number of medical malpractice claims filed against H+H’s acute care hospitals[11] decreased by 54 claims to 347 in FY 2023 from 401 claims filed in FY 2022, a decrease of 13 percent.
Table 4: H+H Medical Malpractice Claims Filed and Settled by H+H Acute Care Hospital, FYs 2022–2023
| HH Acute Care Hospital | Claims Resolved FY 2023 | Amount Paid (In Millions) |
Number of Claims Filed FY 2023 | Number of Claims Filed FY 2022 |
Increase/ (Decrease) |
|---|---|---|---|---|---|
| Bellevue | 7 | $4.1 | 48 | 62 | (14) |
| Coney Island | 1 | $2.0 | 40 | 31 | 9 |
| Elmhurst | 6 | $3.6 | 35 | 45 | (10) |
| Harlem | 3 | $4.5 | 26 | 25 | 1 |
| Jacobi / Bronx Municipal | 9 | $13.6 | 46 | 51 | (5) |
| Kings County | 11 | $3.4 | 48 | 52 | (4) |
| Lincoln | 11 | $10.2 | 39 | 49 | (10) |
| Metropolitan | 4 | $0.9 | 16 | 22 | (6) |
| North Central Bronx | 2 | $1.1 | 9 | 18 | (9) |
| Queens Hospital Center | 1 | $0.0 | 26 | 23 | 3 |
| Woodhull | 6 | $1.6 | 14 | 23 | (9) |
| Total | 61 | $44.9 | 347 | 401 | (54) |
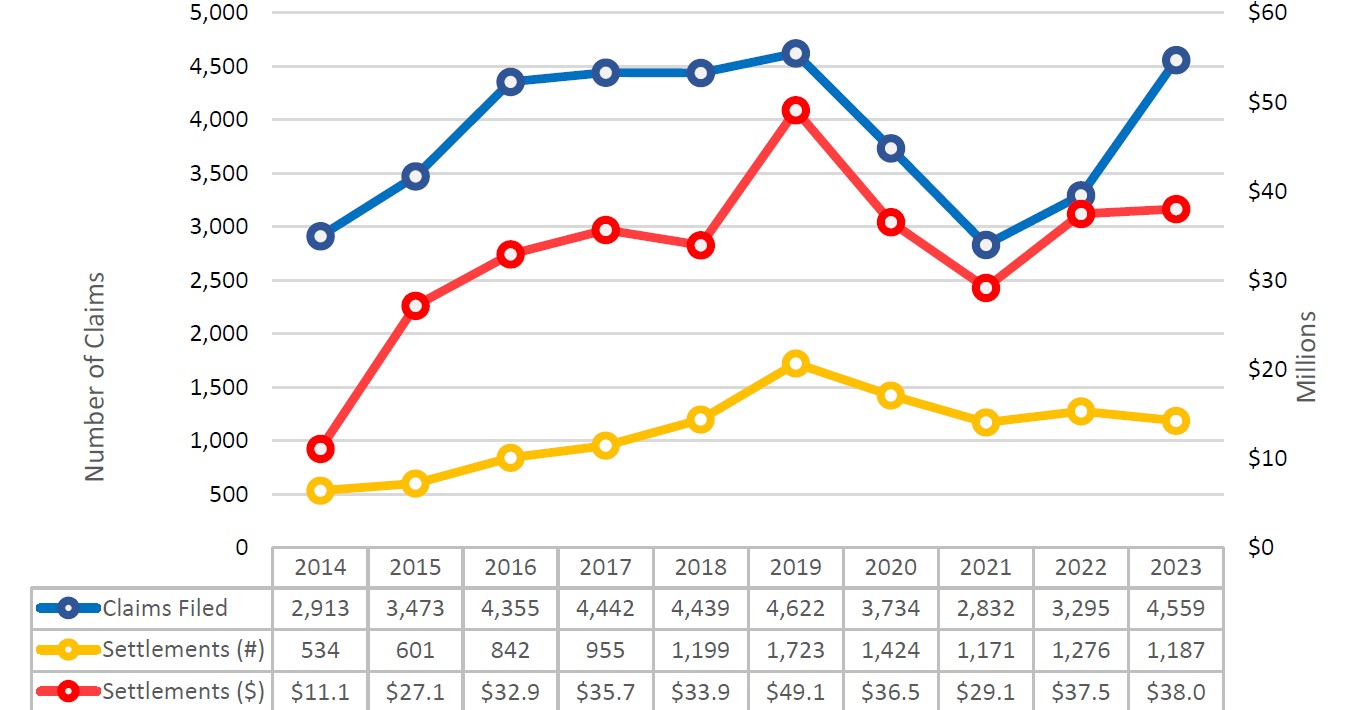
6. Department of Correction
Claims against the Department of Correction (“DOC”) include, but are not limited to, allegations of violence between detainees, use of force against detainees by correction officers, inappropriate conditions of confinement, motor vehicle crashes, and slip and fall incidents. In FY 2023, there were 4,559 DOC claims filed, compared to 3,295 DOC claims filed in FY 2022, a 38 percent increase. The 4,559 DOC claims filed in FY 2023 represents only a one2 percent decline from FY 2019 when DOC peaked with 4,623 claims filed. DOC claim payouts increased to $38.0 million, a one percent increase from FY 2022 when DOC claim payouts totaled $37.5 million. There is a potential for the continuation of higher payouts in the coming years due to an influx of class action filings against DOC that involve excessive detention after posting bail, prolonged incarceration due to improper federal Immigration and Customs Enforcement detention requests, and multiple actions alleging inappropriate conditions of confinement in various DOC facilities during the pandemic. The City is also receiving a large number of death in custody claims for inmate deaths that occurred at Rikers Island over the past several years.
Chart 19: DOC Tort Claims Filed and Settled, FYs 2014–2023
The Comptroller’s Office dedicates significant resources to investigating, evaluating, and, if appropriate, resolving certain claims filed against DOC prior to litigation. The following chart illustrates the results of the Office of the Comptroller’s substantial effort to resolve, when appropriate, claims filed against DOC pre-litigation for a small proportion of the total overall DOC payout.
Table 5: DOC Claim Pre-litigation and Litigation Claim Settlements, FYs 2019-2023
| Fiscal Year | DOC Claims Resolved (all claim types, including Litigation) | DOC Claims Resolved Pre- Litigation) (all claim types) | Percent Resolved Pre-litigation | DOC Claims Payout (all claim types, including Litigation) (in millions) | DOC Claims Payout (Pre-litigation) (in millions) | Percent Paid Pre-Litigation |
|---|---|---|---|---|---|---|
| 2019 | 1,704 | 955 | 56% | $49.0 | $8.4 | 17% |
| 2020 | 1,408 | 993 | 71% | $36.5 | $8.8 | 24% |
| 2021 | 1,167 | 855 | 73% | $29.1 | $8.4 | 29% |
| 2022 | 1,269 | 978 | 77% | $37.4 | $8.9 | 24% |
| 2023 | 1,180 | 866 | 73% | $38.0 | $14.8 | 39% |
| TOTAL | 6,728 | 4,647 | 69% | $190.0 | $49.3 | 26% |
E. Tort Claim Trends by Borough[12]
The Bronx had the most overall tort claims filed, with 7,229 claims, followed by Brooklyn (5,254 claims), Manhattan (4,407 claims), Queens (3,758 claims), and Staten Island (824 claims). Consistent with the prior five fiscal years, the Bronx had the most personal injury claims filed (6,289 claims).
Table 6: Number of Tort Claims Filed by Borough, FY 2023
| Borough | Personal Injury (PI) Claims | Property Damage (PD) Claims | Total Tort Claims |
|---|---|---|---|
| Bronx | 6,289 | 940 | 7229 |
| Brooklyn | 4,001 | 1,253 | 5254 |
| Manhattan | 3,485 | 922 | 4407 |
| Queens | 2,489 | 1,269 | 3758 |
| Staten Island | 533 | 291 | 824 |
The Bronx also had the highest per capita filing of personal injury claims at 464 claims per 100,000 residents mostly due to the fact that Rikers Island facilities are located in the County of Bronx[13]. Staten Island had the fewest personal injury claims with 109 claims per 100,000 residents. Bronx had the greatest number of property damage claims filed per capita, with 69 claims per 100,000 residents, while Brooklyn had the fewest property damage claims with 48 claims per 100,000 residents.[14]
Table 7: Tort Claims Filed by Borough Per 100,000 Residents, FY 2023
| Borough | Total Tort Claims Per 100,000 Residents |
Total PI Claims Per 100,000 Residents | Total PD Claims Per 100,000 Residents |
|---|---|---|---|
| Bronx | 533 | 464 | 69 |
| Brooklyn | 205 | 156 | 49 |
| Manhattan | 276 | 218 | 58 |
| Queens | 167 | 111 | 56 |
| Staten Island | 168 | 109 | 59 |
Table 8: Tort Claims Resolved and Amounts Paid by Borough, FY 2023
| Borough | Number of PI Claims Resolved | Amount Paid for PI Claims (In Millions) | Number of PD Claims Resolved | Amount Paid for PD Claims (In Millions) | Total PI and PD Claims Resolved | Total PI and PD Claim Payouts (In Millions) |
|---|---|---|---|---|---|---|
| Bronx | 2,332 | $197.5 | 200 | $0.7 | 2,532 | $198.2 |
| Brooklyn | 1,231 | $172.8 | 349 | $1.3 | 1,580 | $174.1 |
| Manhattan | 874 | $145.4 | 291 | $2.0 | 1,165 | $147.4 |
| Queens | 572 | $100.9 | 339 | $1.4 | 911 | $102.3 |
| Staten Island | 200 | $29.3 | 126 | $0.4 | 326 | $29.7 |
III. Law (Non-Tort) Claims
Law (non-tort) claims include claims arising from City contracts, equitable claims, refund claims, City employee salary disputes, claims involving DOE special education matters, sidewalk assessments, and cleanup costs levied on property owners who are in violation of the Mental Hygiene Law, as well as affirmative claims brought by the City against other parties.
A. Overall Law Claim Trends
Chart 20: Law Claims Filed and Settled, FYs 2014–2023
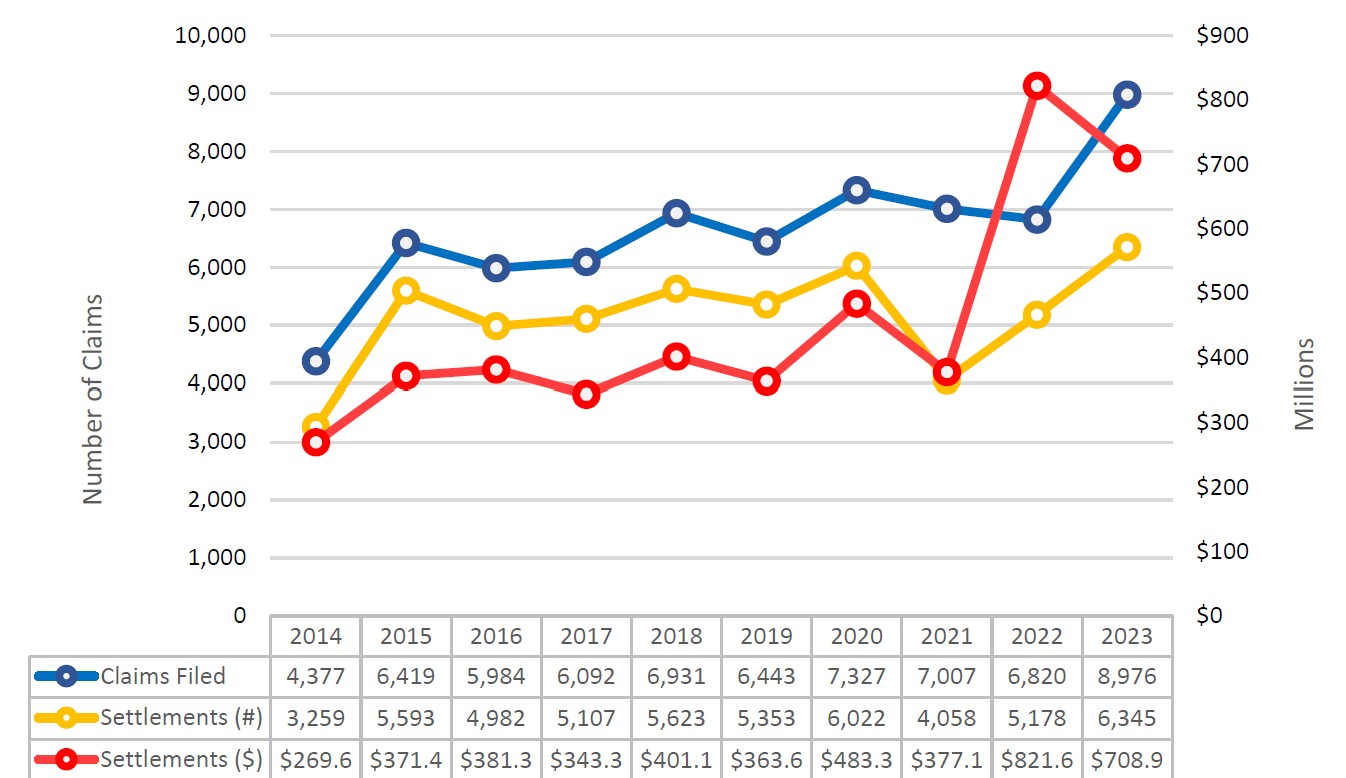
The number of law claims filed increased by 2,156 claims, or 32 percent, to 8,976 claims in FY 2023 from the 6,820 law claims filed in FY 2022. There was a notable increase in the number of salary claims filed, up 36 claims from the 55 claims filed in FY 2022 to 91 claims filed in FY 2023, a 65 percent increase. Special education claims continue to account for the largest proportion—83 percent in FY 2023—of law claims filed.
Chart 21: Comparison of Special Education Claims Filed to All Law Claims Filed, FYs 2014–2023

The total number of law claims settled in FY 2023 increased 23 percent to 6,345 claims from 5,178 claims settled in FY 2022. The total cost of settlements and judgments paid out for law claims decreased 14 percent to $708.9 million in FY 2023 from $821.6 million in FY 2022.[15]
The $112.7 million decrease in law claim payouts in FY 2023 was driven by $176.7 million less in salary claim payments, primarily the decrease in payments for the Gulino class action lawsuit. Payments for the Gulino class action lawsuit, which are to be paid over the period of FY 2022 through FY 2028, decreased from $366.8 million in FY 2022 to $218.8 in FY 2023, a difference of $147.9 million. However, the payments for this class action continue to represent 84 percent of all salary claim payouts and 31 percent of all law claims payout in FY 2023.
The number of special education claims settled in FY 2023 represents 89 percent of all law claims settled. The $397.0 million in special education claim settlements constitutes 56 percent of all law claim payouts in FY 2023.
In FY 2023, contract claims accounted for the third largest law claim payouts at $44.3 million, representing six percent of all law claim payouts. The total number of contract claim settlements make up less than one percent of the total number of all law claim settlements.
Chart 22: Law Claims by Claim Type Amount Paid in Settlements & Judgments (in millions) and Percentage of Law Claim Settlements & Judgments Paid, FY 2023
B. Law Claim Trend by Claim Type
1. Salary Claims
Salary claims are claims for back pay, liquidated damages, and/or attorneys’ fees by prospective, current, or former City employees. These include claims for discrimination, out-of-title work, pay differential, annual leave, and suspension; excluded from this claim type are those claims that seek damages for personal injury.
All claims related to the terms and conditions of City employment began to be classified as labor and employment claims in FY 2019. However, if filed before FY 2019, these claims were categorized as and continue to be recorded under either personal injury civil rights or law salary claim types. Settlement of pre-FY 2019 personal injury civil rights and law salary claims continues. In this report, data for labor and employment claims filed since FY 2019 is reported under both personal injury civil rights and law salary claim type, depending on the nature of the claims. This allows for continuity in the analysis of these types of claims while pre-existing labor and employment related personal injury civil rights claims and law salary claims continue to be resolved. The data reported below is for both pre-FY 2019 law salary claims and post-FY 2019 labor and employment salary claims.
In FY 2023, 91 salary claims were filed, up from the 55 claims filed in FY 2022, an increase of 65 percent. In FY 2023, there were settlement and judgement payouts on 20 salary claims, a decrease of 20 percent from the 25 payouts in FY 2022.
The 20 salary claim settlements and judgments in FY 2023 resulted in payouts of $260.8 million, a $176.7 million decrease from the $437.5 million paid out in FY 2022. However, the payout in FY 2023 is $242.7 greater than the $18.0 million payout in FY 2021, a 1346 percent increase. This massive increase is driven by judgment payments of $366.8 million in FY 2022 and $218.8 million in FY 2023, as damages to class member under a judgment payment schedule and as employer tax contributions and in attorneys’ and experts’ fees and costs, for a single class action, Gulino, et al. v. Board of Education, an employment discrimination suit against DOE. The City and plaintiffs’ counsel agreed to a schedule of judgment payments over seven years, across FYs 2022 to 2028, for payment of up to approximately $1.35 billion in judgments to the class members, so payments will continue for this class action through FY 2028.
Excluding judgments in Gulino, salary claim payouts in FY 2023 totaled $41.9 million, a decrease of $28.8 million, or a 41 percent decrease, from $70.8 million paid out in FY 2022. Of the $41.9 million in non-Gulino payouts, $40.7 million or 97 percent is attributable to seven payouts for alleged violations of Fair Labor Standards Act (FLSA). Multimillion-dollar settlements in three of these FLSA cases resulted in $39.5 million in payouts in FY 2023.
2. Special Education Claims
Special education claims include claims on behalf of parents for the reimbursement of special education services costs and tuition and claims for statutory attorneys’ fees where an underlying claim for special education reimbursement has been successful.
In FY 2023, 7,492 special education claims were filed, a 33 percent increase over special education claims filed in FY 2022, when 5,642 special education claims were filed. In FY 2023, 5,626 special education claims were settled, a 21 percent increase from the 4,641 special education claim settlements in FY 2022. The amount paid out on special education claims increased by 31 percent to $397.0 million during FY 2023, as compared to $303.5 million paid out in FY 2022.
In August 2023, the Comptroller released “Course Correction: Expanding and strengthening special education services improves student outcomes and reduces costly due process claims,” which revealed a tenfold spending increase on special education service claims over the last decade. The cost of these claims, which are filed by families seeking essential services for their children with disabilities, escalated from $33 million to $372 million between FY 2012 and FY 2022. The report identifies flaws and inequities within DOE’s system for delivering special education services (e.g. speech therapy, occupational therapy, classroom support) and offers recommendations for reform to ensure that all children receive the support they need, in a manner that works better for families and is more most cost-effective for the City as well.
Chart 23: Special Education Claims Filed and Settled, FYs 2014–2023

3. Dispute Claims
Contracts between the City and vendors solicited after September 1990 have an alternative dispute resolution provision designed to provide a speedy alternative to litigation. When a dispute under a City contract arises, a contractor attempts to resolve it directly with the City agency involved. If no resolution is reached between the contractor and City agency, the contractor can file a claim with the Comptroller’s Office; these claims are characterized as dispute claims. If the dispute is not resolved by the Comptroller’s Office, the contractor may appeal the agency determination to the Contract Dispute Resolution Board.
In FY 2023, 80 dispute claims were filed, a decrease of 37 percent from the 126 claims filed in FY 2022. In FY 2023, 16 dispute claims were negotiated and resolved by a monetary settlement, down 30% from the 23 monetary settlements in FY 2022. Payouts on these monetary settlements was $0.8 million, a 76 percent decrease from the $3.2 million paid out on dispute claim monetary settlements in FY 2022.[16]
4. Contract Claims
Contract claims arise when there is a disagreement between the City and private contractors (construction or non-construction) that is not subject to a dispute resolution process. The number of contract claims filed in FY 2023 decreased by 42 percent to 73 claims from 125 claims filed in FY 2022. The number of contract claim settlements decreased to 11 contract claims settled in FY 2023 from 14 contract claims settled in FY 2022, a 21 percent decline. There was a 20 percent decrease in the cost of contract claim settlements in FY 2023 to $44.3 million paid out for contract claim settlements from $55.5 million in FY 2022.
Contract claims include a subcategory of claims called delay claims, meaning a contractor alleges that it was damaged by delays caused by the actions or inactions of the City on a construction project. Delay claims typically arise from large construction projects such as those involving construction or renovation of public buildings and infrastructure like bridges, sewers, and wastewater treatment plants.
In FY 2023, there were eight delay claim settlements, accounting for 73 percent of the 11 contract claims settled. The $43.2 million paid out on these eight delay claim settlements make up 98 percent of the $44.3 million in settlements paid out for all contract claims in FY 2023. The negotiated cost of these settlements represents an adjustment of $34.3 million, or 44 percent, from the amount of damages initially claimed by contractors. In FY 2023, delay claim settlements increased the overall cost of the subject projects by eight percent over the total original contract prices.
Of the eight delay claims settled in FY 2023, four delay claims arose out of contracts with the Department of Environmental Protection (DEP). The claims against DEP alleged damages totaling $29.6 million, which the City was able to negotiate and settle for $13.4 million, an adjustment of 55 percent of the claimed damages. The subject DEP contracts had original contract costs totaling $290.9 million. The four DEP settlements totaling $13.4 million increased the aggregate of the four original contract costs by five percent.
Another three delay claims arose out of contracts with the Department of Design and Construction (DDC). The claims against DDC alleged damages totaling $47.3 million, which the City was able to negotiate and settle for $29.5 million, an adjustment of 37 percent of the claimed damages. The subject DDC contracts had original contract costs totaling $221.8 million. The three DDC settlements totaling $29.5 million increased the aggregate of the three original contract costs by 13 percent.
Another delay claim arose out of a contract with the Department of Correction (DOC). The DOC claim alleged damages of $0.6 million, which the City was able to negotiate and settle for a total of $0.3 million, an adjustment of 49 percent of the initial claimed damages. The subject DOC contract had original contract costs totaling $7.1 million. This $0.3 million settlement increased the original contract costs by five percent.
Chart 24: Delay Claim Settlements: Percentage Cost Increase Above Original Contract Bid Price, FY 2023

5. Affirmative Claims
Affirmative claims are those claims brought by the City of New York against individuals, companies, corporations, and other entities for torts, breaches of contract, and as remedies for violations of civil codes. These claims include funds due to the City for housing or building code violations, actions arising from the sale of unlicensed cigarettes and other public nuisances, contract overpayments, and recoupment of Medicaid assistance payments.
In FY 2023, there were 792 requests for settlement authority to resolve affirmative claims, up from 531 requests in FY 2022, a 49 percent increase. In FY 2023, the Comptroller’s Office approved 580 affirmative claim settlements for a benefit to the City totaling $8.1 million, as compared to FY 2022, when 409 affirmative claims were settled for payment to the City of $20.5 million. The FY 2022 affirmative claims recovery was $12.3 million more than the amount recovered in FY 2023, despite 171 fewer settlements than in FY 2023, due in large part to a $12.7 million affirmative settlement of a claim to recover payments fraudulently obtained under a contract with a former Department of Homeless Services (DHS) service provider.
Civil penalty claims are a subcategory of affirmative claims wherein the City seeks monetary penalties for violations of civil codes such as housing or building code violations, the sale of untaxed cigarettes, and the creation of other public nuisances. In FY 2023, the City recovered civil penalties in the amount of $2.7 million on 275 claims, up from $0.6 million in civil penalties recovered on 82 claims in FY 2022, a 383 percent increase in the amount of civil penalties recovered.
IV. Legacy Claims
Settlements of Personal Injury Claims Filed Before FY 2014
New York City taxpayers continue to pay for claims filed more than a decade ago. In FY 2023, the City paid out $77.4 million to settle personal injury claims filed before FY 2014.[17]
Chart 25: Personal Injury Claim Settlements for Legacy Claims, FYs 2014–2023

In FY 2023, the City continued to reduce the backlog of claims filed more than ten years ago. The key driver – 75 percent of this FY 2023’s legacy payouts — was the resolution of H+H claims (28 percent), NYPD claims (24 percent) and DOT claims (23 percent).
V. Overview of the Comptroller’s Initiatives to Manage Risk and Implement Best Practices
Pre-litigation Settlement of Claims
The City Charter authorizes the Comptroller to settle claims prior to litigation; once cases enter litigation, the Law Department takes primary responsibility, though the Comptroller still must approve proposed settlements. BLA dedicates significant resources to investigating, evaluating, and, if appropriate, resolving claims prior to litigation. Resolving meritorious claims pre-litigation results in substantial financial savings to the City while allowing the Law Department to allocate resources to defend cases involving core City policies or important precedent. Early resolution of meritorious claims provides prompt relief to New Yorkers harmed by actions or inactions of the City, since the Comptroller’s Office is empowered to offer pre-litigation settlements up to a year and 90 days from the date of the incident, while litigation may take years.
1. Personal Injury Claims
BLA settled 2,231 personal injury claims pre-litigation in FY 2023. This represents 41 percent of the total 5,446 personal injury claim settlements recorded in FY 2023. While these pre-litigation settlements account for 41 percent of the total number of personal injury claim settlements recorded, they account for six percent of all personal injury claim payouts in FY 2023, since more complex cases are generally more likely to go to litigation.
Table 9: Personal Injury Claims, Pre-litigation and Litigation Settlements, FYs 2019-2023
| Fiscal Year | Total Personal Injury Claims Resolved
(Pre-litigation and Litigation) |
Personal Injury Claims Resolved Pre-litigation | Personal Injury Claims Resolved Pre-litigation
(Percent) |
Total Personal Injury Claim Expenditures (Pre-litigation and Litigation) (in millions) | Total Personal Injury Claim Expenditures (Pre-litigation) (in millions) | Pre-litigation Personal Injury Claims (Percent of Total Personal Injury Claim Expenditure) |
|---|---|---|---|---|---|---|
| 2019 | 6,883 | 2,638 | 38% | $658.4 | $64.1 | 10% |
| 2020 | 6,588 | 2,486 | 38% | $603.5 | $45.0 | 7% |
| 2021 | 5,306 | 2,006 | 38% | $586.6 | $49.5 | 8% |
| 2022 | 5,675 | 2,353 | 41% | $730.1 | $58.7 | 8% |
| 2023 | 5,446 | 2,231 | 41% | $733.3 | $42.5 | 6% |
| TOTAL | 29,898 | 11,714 | 39% | $3,311.9 B | $259.8 | 8% |
2. Property Damage Claims
BLA settled 930 property damage claims pre-litigation in FY 2023. Pre-litigation property damage claim settlements represent 65 percent of the total 1,436 property damage settlements and account for 49 percent of the total property damage payouts in FY 2023.
Table 10: Property Damage Claims Pre-litigation and Litigation Settlements, FYs 2019-2023
| Fiscal Year | Total Property Damage Claims Resolved (Pre-litigation and Litigation) | Property Damage Claims Resolved Pre-litigation | Property Damage Claims Resolved Pre-litigation
(Percent) |
Total Property Damage Claim Expenditure (Pre-litigation and Litigation) (in millions) | Total Property Damage Claim Expenditure (Pre-litigation) (in millions) | Pre-litigation Property Damage Claims (Percent of Total Property Damage Claim Expenditure) |
|---|---|---|---|---|---|---|
| 2019 | 2,139 | 1,446 | 68% | $7.5 | $3.7 | 50% |
| 2020 | 1,698 | 1,148 | 68% | $6.9 | $3.5 | 51% |
| 2021 | 1,530 | 927 | 61% | $6.7 | $3.7 | 55% |
| 2022 | 1,588 | 989 | 62% | $7.8 | $3.1 | 40% |
| 2023 | 1,436 | 930 | 65% | $6.3 | $3.0 | 49% |
| TOTAL | 8,391 | 5,440 | 65% | $35.2 | $17.0 | 48% |
3. Law Claims
In FY 2023, BLA resolved 6,005 claims pre-litigation, or 95 percent, of all law claim settlements against the City. Over the past five fiscal years, BLA has settled an increasing number of law claims pre-litigation. Pre-litigation law claim settlements account for 55 percent of all law claim payouts in FY 2023.
Table 11: Law Claims Pre-litigation and Litigation Settlements, FYs 2019-2023
| Fiscal Year | Total Law Claims Resolved (Pre-litigation and Litigation) | Law Claims Resolved Pre-litigation |
Law Claims Resolved Pre-litigation
(Percent) |
Total Law Claim Expenditure (Pre-litigation and Litigation) (in millions) |
Total Law Claim Expenditure (Pre-litigation) (in millions) | Pre-litigation Law Claims (Percent of Total Law Claim Expenditure) |
|---|---|---|---|---|---|---|
| 2019 | 5,353 | 4,198 | 78% | $363.6 | $285.6 | 79% |
| 2020 | 6,022 | 5,589 | 93% | $485.7 | $362.4 | 75% |
| 2021 | 4,058 | 3,763 | 93% | $377.0 | $228.0 | 60% |
| 2022 | 5,178 | 4,848 | 94% | $821.6 | $299.5 | 36% |
| 2023 | 6,345 | 6,005 | 95% | $708.2 | $390.6 | 55% |
| TOTAL | 26,956 | 24,403 | 91% | $2,756.1 | $1,566.1 | 57% |
Inter-Agency Partnerships
The Comptroller’s Office BLA participates in regularly scheduled conference calls with several City agencies—the NYPD, DSNY, and DOC—to discuss claims, help find ways to better manage risk, and recommend best practices. BLA discusses claim-filing trends with high-level agency risk managers and suggests policies that may prevent the filing of similar claims in the future.
Recovery Program Update
The Comptroller’s Office partners with the Human Resources Administration—particularly with the Office of Child Support Enforcement (OCSE)—to collect reimbursements for public assistance and Medicaid benefits, as well as child support obligations, from claimants who receive settlement payouts from the City. The Comptroller’s Office also works with the New York City Department of Finance to collect offsets, including unpaid parking tickets, against claimants who reach a settlement with the City. In FY 2023, the Comptroller’s Office collected $7.5 million from claimants with outstanding obligations to the City, including $4.6 million in Medicare/Medicaid liens, $1.4 million in child support arrears, and $942,897 in parking violation bureau judgments.
Son of Sam Law (New York State Executive Law § 632-a)
The New York State Son of Sam Law allows a crime victim to commence a civil action to recover money damages for “profits from a crime” or the “funds of a convicted person.”[18] Under the law, the Comptroller’s Office must report to the New York State Office of Victim Services (Victim Services) any City settlement obligation to a convicted person that exceeds $10,000. In FY 2023, the City collected $307,982 from convicted claimants or plaintiffs who recovered settlement monies from the City. In compliance with the Son of Sam Law, these funds were distributed to victims of the crimes committed by these claimants or plaintiffs. Since FY 2011, the City has dispersed $2.2 million to crime victims under the Son of Sam Law.
Appendices
Appendix A: Description of Claim Types
Claims that are filed against the City are classified into categories to facilitate analysis by the Comptroller’s Office and other interested parties.
Under the present classification structure, claims are designated as personal injury, property damage, law, or labor and employment (starting in FY 2019). Additionally, claims are categorized by the City agency involved and by the claim type based on the allegations in the notice of claim, as defined below:
I. Personal Injury Claims
- Admiralty
Admiralty claims include claims by passengers or other persons injured on the water, either on City vessels or ferries, gangplanks, or piers. - Roadway
Roadway claims include pedestrians, motorists, or others claiming injury as a result of alleged defects in a street or roadway, such as potholes; cracked, wet, or snow-covered roadways; sewer gratings; raised, missing, or exploding manhole covers; or roadways under repair. - Sidewalk
Sidewalk claims include pedestrians or others claiming injury because of an allegedly defective sidewalk such as, broken or uneven sidewalks; broken curbstones; protruding bolts, grates, parking meter or traffic sign stubs; defective boardwalks; and snow and ice claims. - Traffic Control Device
Traffic control device claims are filed by pedestrians or motorists injured in accidents caused by allegedly malfunctioning traffic signals, defective or missing traffic devices, or downed or missing traffic signs. - Police Action
Police action claims result from alleged improper police action, such as false arrest or imprisonment, excessive force or assault, or failure to provide police protection. - School
School claims are filed against the DOE by students, teachers, other staff, parents, or visitors alleging injury at DOE facilities. - Medical Malpractice
Medical malpractice claims derive from alleged medical malpractice in the diagnosis, treatment, or care at a City or H+H facility or from EMS treatment. - Health Facility/Non-Medical Incidents
Health facility claims stem from non-medical acts involving a City or H+H facility or employee, such as allegations of injury sustained by visitors due to wet floors, assaults of patients or visitors, loss of sepulcher, or abuse or assault of a senior citizen by a home care worker. - Motor Vehicle
Motor vehicle claims involve alleged accidents with City-owned vehicles including claims by pedestrians, motorists, or passengers of other vehicles allegedly struck by a City-owned vehicle and operators or passengers of a City-owned vehicle involved in a collision. - Uniformed Services Employee
Uniformed services employee claims are filed by City uniformed services employees, such as NYPD, FDNY, or DSNY employees and DOE teachers who are not subject to Workers’ Compensation laws and may assert claims against the City for on-the-job personal injury. - Parks and Recreation
Parks and recreation claims are asserted by persons injured because of allegedly defective equipment or negligent maintenance of property under the jurisdiction of the Department of Parks and Recreation. This includes incidents that occur in Parks Department buildings or on playground equipment and grounds, and incidents involving falling trees or limbs on a street, sidewalk, or in a park. - City Property
City property claims by tenants or others asserting injury by an alleged defect in or the negligent maintenance of City-owned land, or a City-owned or City-administered building or facility. - Catastrophe
Catastrophe claims are filed as a result of natural disasters, such as floods or earthquakes; environmental accidents, such as leaking gas tanks; power failures, such as blackouts; and civil disturbances, such as riots. - Civil Rights
- Civil rights claims involve alleged statutory or constitutional violations, such as discrimination based on sex/gender, race, religion, disability, or age. Claims in this category also include alleged constitutional civil rights violations by law enforcement personnel such as false arrest, malicious prosecution, excessive force, or reversed conviction claims litigated under 42 U.S.C. § 1983 in federal court.
- Correction Facility
Correction facility claims are filed by inmates, detainees, employees of and visitors to City correction facilities or institutions alleging injury by the actions of City employees or inmates. - Affirmative Claims
Affirmative claims brought by the City against individuals, companies, and corporations for damage to City property.
II. Property Damage Claims
- Admiralty
Admiralty claims are for alleged property damage on the water, either on City vessels, ferries, gangplanks, or piers. - Sewer Overflow
Sewer overflow claims include alleged flooding or water damage to real or personal property caused by inadequate sewer repairs or clogged or obstructed City sewers. - Water Main Break
Water main break claims include alleged water damage to real or personal property as a result of leaking or broken water mains, potable water line claims such as 3-day and 10-day notices, leaking hydrants, and leaking water meter claims. - Roadway
Roadway claims include vehicles that are damaged by allegedly defective roadways, or from objects that have fallen from bridges or overpasses. Also included in this claim type are claims by pedestrians who sustained damage to personal property as a result of falling on an allegedly defective roadway. - Sidewalk
Sidewalk claims are filed by individuals who sustain damage to personal property as a result of an allegedly defective sidewalk. - Traffic Control Device
Traffic control device claims include vehicles or other personal property damaged in accidents allegedly caused by defective, obstructed, or missing traffic lights or stop signs. - Police Action
Police action claims relate to vehicles or other personal property allegedly stolen, damaged, sold, or destroyed while in police custody. - School
- School claims include allegations for lost, stolen, or damaged personal property that belongs to students, teachers, or DOE staff while on DOE property.
- Health Facility
Health facility claims include the personal property of patients or others that has allegedly been lost, stolen, or damaged while on H+H or City hospital property. - Motor Vehicle
Motor vehicle claims include vehicles or other personal property allegedly damaged in accidents with City-owned vehicles. Included in this claim type are parked cars allegedly hit by City-owned vehicles and vehicles damaged while being towed. - Uniformed Services/City Employees
Uniformed services/city employee claims include personal property allegedly lost, damaged, or stolen from City employees while at work. - Parks and Recreation
- Parks and recreation claims include personal property lost, stolen, or damaged in the City’s parks allegedly due to vandalism, poor maintenance, unmarked fresh paint, or accidents involving grounds and equipment.
- Public Buildings and Property
Public buildings and property claims include personal property damaged or stolen as a result of an alleged defect or negligence in maintaining City-owned land, buildings, or facilities. - Catastrophe
Catastrophe claims include property damage allegedly caused by the City’s response to a natural disaster, such as floods or earthquakes; an environmental accident, such as leaking gas tanks; power failures, such as blackouts; or civil disturbances, such as riots. - Damage City Action/Personnel
These claims include property damage allegedly caused by City-owned vehicles or equipment, such as a City-owned vehicle that damages a homeowner’s fence or other property, or damage caused by a traffic light falling onto a vehicle. - Correction Facility
Correction facility claims are filed by inmates, detainees, employees of and visitors to City correction facilities or institutions whose personal property is allegedly lost, stolen, or damaged.
III. Law Claims
Contract
Claims in this category arise from disputes between the City and private contractors (construction or non-construction) and where the City is a lessee or lessor of property.
Dispute
Contracts between the City and vendors solicited after September 1990 include an alternative dispute resolution provision designed to provide a speedy alternative to litigation. This process is also embodied in Section 4-09 of the City’s Procurement Policy Board rules. When disputes arise, contractors may attempt to resolve them directly with the City agency involved. If no agreement is reached with the City agency, a claim can be filed with the Comptroller’s Office. If the claim is denied, the contractor may appeal to the Contract Dispute Resolution Board.
Illegal but Equitable
Illegal but equitable claims typically allege that work was performed at the direction of the City and/or the City accepted services, without a registered contract that would allow the City to pay for the goods or services received. These claims, though invalid at law, may be recognized as equitable and proper if it can be determined that the City received a benefit and that the public interest would be served by payment or compromise.
Salary
Salary claims are those claims for back pay and/or attorneys’ fees by prospective, current, or former City employees alleging employment related disputes. These disputes include claims for discrimination, out-of-title work, pay differential, annual leave, and suspension; excluded from this claim type are those claims that seek damages for personal injury. Beginning in FY 2019, all claims filed related to the terms and conditions of City employment are classified as labor and employment claims. Therefore, such claims are no longer recorded as salary claims.
Refund
Refund claims include claims by private individuals seeking refunds for alleged overpayments and unjust fines.
Change of Grade
Change of grade claims are made by commercial or residential property owners or lessees. The claims arise from changes in grade to a sidewalk that impair access to property and drainage. Claims typically are made for loss of business due to walkway or driveway repairs.
Special Education
Special education claims are on behalf of parents for the reimbursement of special education services costs and tuition and claims for statutory attorneys’ fees where an underlying claim for special education reimbursement has been successful.
Affirmative Claims
Affirmative claims brought by the City against individuals, companies, and corporations for torts, breaches of contract, and remedy for violations of civil code.
Appendix B: Legal Background
I. Municipal Liability
The decision of the New York Court of Appeals in Bernadine v. New York City, issued in 1945, exposed the City for the first time to liability for torts committed by the City’s officers, agents, and employees.[19]
In Bernadine, the Court held that “the civil divisions of the State are answerable equally with individuals and private corporations for wrongs of officers and employees—even if no separate statute sanctions that enlarged liability in a given instance.”[20] The Court, in effect, abolished the doctrine of sovereign immunity for municipalities and did not provide municipalities any of the protections accorded to the State by the Court of Claims Act.[21] In particular, claimants seeking to recover from municipalities for an agent’s alleged negligent and wrongful acts are entitled to a jury trial.
Municipal liability is also governed by local law. Under home rule authority, municipalities can limit liability to some extent through limitations on the right to sue. An example is New York City’s “prior written notice” law, enacted in 1979 in an effort to limit the City’s liability in slip and fall claims on City sidewalks and streets.
II. Claims Process
To commence an action against the City, a claimant typically must first notify the City by filing a Notice of Claim with the Comptroller’s Office.[22] However, claims against H+H, must be filed directly with H+H. In most instances, the notice of claim for personal injury or property damage claims must be filed within 90 days of the occurrence of an alleged injury or wrong.[23]
The City Charter grants the Comptroller the power to settle and adjust all claims in favor of or against the City.[24] The Comptroller has the power to investigate claims, evaluate liability and damages, and reach a settlement prior to litigation.[25] If the Comptroller denies liability or is unable to arrive at a settlement with a claimant, the claimant may commence a lawsuit. Actions regarding tort claims must generally be filed within one year and 90 days from the date of loss.[26] The New York City Law Department defends the City in most actions (H+H defends its medical malpractice actions). No litigation can be settled without the approval of the Comptroller.[27]
Appendix C: Reversed Conviction Claim Settlements FYs 2016–2023
(* indicates pre-litigation settlements, **indicates post-verdict)
| FY 2023 | ||
|---|---|---|
| Name | Years Incarcerated | Settlement |
| Muhammad Aziz | 20.25 years (1965-1985) | $13 million |
| Khalil Islam | 22 years (1965-1987) | $13 million |
| Johnny Hincapie | 25 years (1990-2015) | $12.875 million |
| Felipe Rodriguez | 27 years (1990-2017) | $10 million |
| Emmanuel Cooper | 27 years (1993-2030) | $10 million |
| Richard Rosario** | 19.75 years (1996-2016) | $9 million |
| Austin Babb | 9.5 years (2010-2020) | $3.95 million |
| Jawaun Fraser** | 2.1 years (2016-2018) | $3.675 million |
| Robert Majors | 10 years (2001-2011) | $3.3 million |
| Shomari Laviscount | 5.5 years (2008-2014) | $1.5 million |
| Antoine Weeks | 3.5 years (2016-2020) | $750,000 |
| Desmond Laverpool* | 2 years (2016-2018) | $183,000 |
| John Maglione* | 2 years (2017-2019) | $30,000 |
| FY 2022 | ||
|---|---|---|
| Name | Years Incarcerated | Settlement |
| Samuel Brownridge | 25 years (1994-2019) | $13 million |
| Pablo Fernandez | 24 years (1995-2019) | $12 million |
| Shawn Willliams | 24 years (1993-2018) | $10.5 million |
| Rafel Ruiz* | 25 years (1984-2009) | $8.99 million |
| Gerard Domond* | 28 years (1998-2016) | $8.4 million |
| Eric William Rodriguez | 21.17 years (1999-2021) | $7 million |
| Grant Williams* | 23 years (1996-2019) | $7 million |
| Julio Negron | 9.75 years (2006-2015) | $6.25 million |
| Bladimil Arroyo | 17.5 years (2001-2019) | $5.35 million |
| Calvin Buari | 22 years (1995-2017) | $4 million |
| Rhian Taylor | 8.75 years (2008-2017) | $3 million |
| Triston Pinheiro | 2.83 years (2005-2008) | $500,000 |
| Phillip Boykin* | 3 years (2016-2019) | $390,000 |
| Alfred Edwards | 1 year (2011-2012) | $175,000 |
| Danny Ponder* | 2.5 years (2018-2021) | $150,000 |
| O’Neal Watts | 5 years (2013-2018) | $100,000 |
| FY 2021 | ||
|---|---|---|
| Name | Years Incarcerated | Settlement |
| Huwe Burton | 20 years (1989-2009) | $11 million |
| David Bryant* | 43 years (1975-2013; 2014-2019) | $11 million |
| Carlos Weeks* | 26.17 years (1993-2019) | $8.3 million |
| Kareem Bellamy | 14.25 years (1994-2008) | $8 million |
| Edward Garry | 22 years (1995-2017) | $7.7 million |
| John Bunn | 16 years (1991-2007) | $5.9 million |
| Larry McKee | 22 years (1996-2018) | $4.89 million |
| Shuaib O’Neil | 3.5 years (2010-2013) | $1.7 million |
| Trevor Lucas | 4.17 years (2014-2018) | $525,000 |
| FY 2020 | ||
| Name | Years Incarcerated | Settlement |
| Gregory Counts* | 26.5 years (1991-2017) | $8.246 million |
| Derrick Hamilton | 20.7 years (1991-2011) | $6.625 million |
| VanDyke Perry* | 10.75 years (1991-2001) | $3.5 million |
| Ricardo Benitez | 5.75 years (2009-2015) | $1.75 million |
| FY 2019 | ||
|---|---|---|
| Name | Years Incarcerated | Settlement |
| Mark Denny* | 30 years (1988-2018) | $9.75 million |
| Rosean Hargrave* | 24 years (1991-2015) | $6.7 million |
| Jabbar Washington* | 21.5 years (1996-2017) | $5.75 million |
| Sundhe Moses* | 18.25 years (1995-2018) | $3.7 million |
| Tyrone Hicks | 7 years (2000-2007) | $3.25 million |
| Steven Odiase* | 6 years (2011-2017) | $1.1 million |
| Dejuan Battle | 4.5 years (2010-2014) | $675,000 |
| FY 2018 | ||
|---|---|---|
| Name | Years Incarcerated | Settlement |
| Andre Hatchett | 25 years (1991-2016) | $12.25 million |
| Ruddy Quezada | 24 years (1991-2015) | $9.5 million |
| Clifford Jones* | 29 years (1981-2010) | $7.5 million |
| Joel Fowler | 7.5 years (2008-2015) | $2.5 million |
| Paul Gatling* | 10 years (1964-1974) | $1.5 million |
| FY 2017 | ||
|---|---|---|
| Name | Years Incarcerated | Settlement |
| Antonio Yarbough | 22 years (1992-2015) | $13 million |
| Abdul Sharrif Wilson | 22 years (1992-2015) | $13 million |
| Everton Wagstaffe | 23 years (1992-2014) | $11.43 million |
| Amaury Villalobos* | 32 years (1980-2012) | $9.7 million |
| William Vasquez* | 32 years (1980-2012) | $9.7 million |
| William Lopez | 23 years (1990-2013) | $8.25 million |
| Reginald Connor | 16 years (1992-2008) | $7.95 million |
| Fernando Bermudez | 18 years (1991-2009) | $7 million |
| Derrick Deacon | 23 years (1990-2013) | $6 million |
| David McCallum | 29 years (1986-2015) | $5.5 million |
| William Stuckey | 16 years (1986-2001) | $3 million |
| Vanessa Gathers* | 10 years (1997-2007) | $2.4 million |
| Martin Nnodimele | 3.75 years (2007-2011) | $2 million |
| Raymond Mora* | 8 years (1981-1989) | $1 million |
| FY 2016 | ||
|---|---|---|
| Name | Years Incarcerated | Settlement |
| Alan Newton | 22 years (1984-2006) | $12 million |
| Devon Ayers | 18 years (1995-2013) | $8 million |
| Michael Cosme | 18 years (1995-2013) | $8 million |
| Eric Field | 18 years (1995-2013) | $8 million |
| Carlos Perez | 18 years (1995-2013) | $8 million |
| Cathy Watkins | 18 years (1995-2013) | $8 million |
| Shabaka Shakur* | 27 years (1988-2015) | $5.5 million |
| Roger Logan* | 16.5 years (1997-2013) | $3.8 million |
| Marcus Poventud | 9 years (1997-2006) | $3 million |
Appendix D: Chart and Table Index
| CHART | TITLE | PAGE |
| 1 | Comparison of Tort Claims Filed: Property Damage Claims vs. Personal Injury Claims, FY 2023 | 13 |
| 2 | Percentage of Property Damage Claim Settlements & Judgments, Recorded by Claim Type, FY 2023 | 14 |
| 3 | Total Amount Paid Out for Property Damage Claim Settlements & Judgments, Recorded by Claim Type, FY 2023 | 14 |
| 4 | Percentage of Personal Injury Claim Settlements & Judgments, Recorded by Claim Type, FY 2023 | 15 |
| 5 | Total Amount Paid Out for Personal Injury Claim Settlements & Judgments Recorded by Claim Type, FY 2023 | 16 |
| 6 | Civil Rights Claims Filed and Settled, FYs 2014–2023 | 17 |
| 7 | Reversed Conviction Payouts, FYs 2016–2023 | 19 |
| 8 | Personal Injury Motor Vehicle Claims Filed and Settled, FYs 2014–2023 | 20 |
| 9 | Personal Injury Police Action Claims Filed and Settled, FYs 2014–2023 | 21 |
| 10 | Medical Malpractice Claims Filed and Settled, FYs 2014–2023 | 23 |
| 11 | Percentage of Tort Claims Filed by Agency, FY 2023 | 24 |
| 12 | Tort Claim Settlement Costs by Agency, FY 2023 | 25 |
| 13 | Number and Percentage of NYPD Tort Claims Filed by Claim Type, FY 2023 | 26 |
| 14 | NYPD Tort Claims Filed and Settled, FYs 2014–2023 | 27 |
| 15 | DOE Tort Claims Filed and Settled, FYs 2014–2023 | 29 |
| 16 | DOT Tort Claims Filed and Settled, FYs 2014–2023 | 30 |
| 17 | DSNY Tort Claims Filed and Settled, FYs 2014–2023 | 31 |
| 18 | H+H Tort Claims Filed and Settled, FYs 2013–2023 | 32 |
| 19 | DOC Tort Claims Filed and Settled, FYs 2014–2023 | 34 |
| 20 | Law Claims Filed and Settled, FYs 2014–2023 | 37 |
| 21 | Comparison of Special Education Claims Filed to All Law Claims Filed, FYs 2014–2023 | 38 |
| 22 | Law Claims by Claim Type Amount Paid in Settlements & Judgments (in millions) and Percentage of Law Claim Settlements & Judgments Paid, FY 2023 | 39 |
| 23 | Special Education Claims Filed and Settled, FYs 2014–2023 | 41 |
| 24 | Delay Claim Settlements: Percentage Cost Increase Above Original Contract Bid Price, FY 2023 | 43 |
| 25 | Personal Injury Claim Settlements for Legacy Claims, FYs 2014–2023 | 45 |
| TABLE | TITLE | PAGE |
| 1 | Reversed Conviction Settlements, FY 2023 | 18 |
| 2 | Personal Injury Police Action Claim Pre-litigation and Litigation Settlements, FYs 2019-2023 | 22 |
| 3 | Reversed Conviction Claims, FYs 2016–2023 | 28 |
| 4 | H+H Medical Malpractice Claims Filed and Settled by H+H Acute Care Hospital, FYs 2022–2023 | 33 |
| 5 | DOC Claim Pre-litigation and Litigation Claim Settlements, FYs 2019-2023 | 34 |
| 6 | Number of Tort Claims Filed by Borough, FY 2023 | 35 |
| 7 | Tort Claims Filed by Borough Per 100,000 Residents, FY 2023 | 35 |
| 8 | Tort Claims Resolved and Amounts Paid by Borough, FY 2023 | 36 |
| 9 | Personal Injury Claims, Pre-litigation and Litigation Settlements, FYs 2019-2023 | 46 |
| 10 | Property Damage Claims Pre-litigation and Litigation Settlements, FYs 2019-2023 | 47 |
| 11 | Law Claims Pre-litigation and Litigation Settlements, FYs 2019-2023 | 47 |
Appendix E: Detailed Tables
Table I – Number of All Claims Filed by Tort and Law Claims, FYs 2014–2023
| 2014 | 2015 | 2016 | 2017 | 2018 | 2019 | 2020 | 2021 | 2022 | 2023 | |
| Tort | 29,025 | 27,417 | 26,926 | 25,019 | 25,336 | 24,416 | 21,343 | 20,129 | 25,752 | 24,162 |
| Law | 4,377 | 6,419 | 5,984 | 6,092 | 6,931 | 6,443 | 7,327 | 7,007 | 6,820 | 8,976 |
| Total | 33,402 | 33,836 | 32,910 | 31,111 | 32,267 | 30,859 | 28,670 | 27,136 | 32,572 | 33,138 |
Table II – Dollar Amount of All Claim Settlements & Judgments by Tort and Law Claims, FYs 2014–2023
| 2014 | 2015 | 2016 | 2017 | 2018 | |
| Tort | $568,765,733 | $589,223,701 | $640,430,578 | $764,426,053 | $681,075,373 |
| Law | $269,552,023 | $371,352,717 | $381,253,416 | $343,319,265 | $401,063,421 |
| Total | $838,317,756 | $960,576,418 | $1,021,683,994 | $1,107,745,318 | $1,082,138,795 |
| 2019 | 2020 | 2021 | 2022 | 2023 | |
| Tort | $665,896,525 | $610,396,085 | $593,246,708 | $737,845,810 | $739,628,596 |
| Law | $363,620,681 | $483,346,042 | $377,092,959 | $821,577,679 | $708,886,614 |
| Total | $1,029,517,206 | $1,093,742,127 | $970,339,667 | $1,559,423,489 | $1,448,515,210 |
Table III – Number of All Claim Settlements & Judgments by Tort and Law Claims, FYs 2014–2023
| 2014 | 2015 | 2016 | 2017 | 2018 | 2019 | 2020 | 2021 | 2022 | 2023 | |
| Tort | 10,850 | 10,328 | 9,866 | 9,260 | 8,869 | 9,022 | 8,286 | 6,836 | 7,263 | 6,882 |
| Law | 3,259 | 5,593 | 4,982 | 5,107 | 5,623 | 5,353 | 6,022 | 4,058 | 5,178 | 6,345 |
| Total | 14,109 | 15,921 | 14,848 | 14,367 | 14,492 | 14,375 | 14,308 | 10,894 | 12,441 | 13,227 |
Table IV – Number of Tort Claims Filed by Claim Type, FYs 2014–2023
| 2014 | 2015 | 2016 | 2017 | 2018 | 2019 | 2020 | 2021 | 2022 | 2023 | |
| Personal Injury | ||||||||||
|---|---|---|---|---|---|---|---|---|---|---|
| Sidewalk | 2,530 | 2,560 | 2,390 | 2,347 | 2,300 | 2,275 | 2,005 | 2,135 | 2,141 | 2,350 |
| Police Action | 5,642 | 4,930 | 4,485 | 4,105 | 4,197 | 3,613 | 3,868 | 3,221 | 2,902 | 5,092 |
| School | 966 | 926 | 962 | 860 | 783 | 692 | 652 | 323 | 606 | 609 |
| Motor Vehicle | 1,260 | 1,166 | 1,230 | 1,268 | 1,438 | 1,352 | 1,390 | 1,201 | 1,480 | 1,693 |
| Roadway | 1,003 | 964 | 1,049 | 945 | 929 | 1,040 | 912 | 813 | 1,008 | 1,072 |
| City Property | 683 | 652 | 708 | 567 | 747 | 624 | 514 | 556 | 789 | 597 |
| Correction Facility | 2,242 | 2,799 | 3,665 | 3,836 | 3,891 | 3,745 | 3,330 | 2,554 | 3,001 | 4,118 |
| Civil Rights | 2,937 | 2,747 | 2,354 | 1,737 | 1,568 | 2,030 | 1,248 | 1,266 | 1,500 | 1,450 |
| Medical Malpractice | 588 | 629 | 620 | 537 | 477 | 482 | 393 | 342 | 441 | 398 |
| Traffic Control Device | 78 | 79 | 62 | 41 | 64 | 77 | 41 | 60 | 43 | 44 |
| Parks & Recreation | 278 | 300 | 307 | 259 | 233 | 205 | 200 | 256 | 223 | 229 |
| Uniformed Services Employee | 162 | 159 | 169 | 164 | 187 | 176 | 159 | 209 | 166 | 147 |
| Other | 884 | 845 | 776 | 783 | 898 | 973 | 911 | 884 | 902 | 1,096 |
| Total | 19,253 | 18,756 | 18,777 | 17,449 | 17,712 | 17,284 | 15,623 | 13,820 | 15,202 | 18,895 |
| Property Damage | ||||||||||
| Motor Vehicle | 3,682 | 3,433 | 3,895 | 3,582 | 3,617 | 3,388 | 2,680 | 2,931 | 2,602 | 2,478 |
| City Property | 260 | 201 | 162 | 138 | 133 | 178 | 114 | 108 | 140 | 137 |
| Correction Facility | 318 | 354 | 286 | 301 | 245 | 213 | 167 | 131 | 124 | 121 |
| City Personnel | 962 | 1,045 | 1,264 | 1,151 | 1,171 | 1,029 | 966 | 1,202 | 809 | 979 |
| Roadway | 2,844 | 2,239 | 1,585 | 1,333 | 1,397 | 1,217 | 704 | 998 | 1,060 | 731 |
| Health Facility | 140 | 122 | 108 | 150 | 85 | 78 | 93 | 101 | 63 | 64 |
| Police Action | 341 | 302 | 226 | 230 | 203 | 186 | 157 | 223 | 143 | 221 |
| School | 128 | 89 | 100 | 119 | 93 | 110 | 60 | 5 | 60 | 73 |
| Sewer Overflow | 613 | 452 | 110 | 140 | 153 | 153 | 249 | 125 | 5,118 | 163 |
| Water Main | 240 | 154 | 111 | 140 | 194 | 194 | 232 | 206 | 96 | 102 |
| Other | 244 | 270 | 302 | 286 | 333 | 386 | 298 | 279 | 335 | 198 |
| Total | 9,772 | 8,661 | 8,149 | 7,570 | 7,624 | 7,132 | 5,720 | 6,309 | 10,550 | 5,267 |
| Grand Total | 29,025 | 27,417 | 26,926 | 25,019 | 25,336 | 24,416 | 21,343 | 20,129 | 25,752 | 24,162 |
Table V – Number of Tort Claims Filed by Agency,
FYs 2014–2023
| 2014 | 2015 | 2016 | 2017 | 2018 | 2019 | 2020 | 2021 | 2022 | 2023 | |
| Department of Transportation | 6,306 | 5,635 | 5,209 | 4,773 | 4,817 | 4,697 | 3,822 | 3,984 | 4,345 | 4,296 |
| Police Department | 9,497 | 8,427 | 7,599 | 6,565 | 6,497 | 5,851 | 5,729 | 5,176 | 4,588 | 6,891 |
| Department of Sanitation | 2,412 | 2,304 | 2,169 | 2,075 | 1,805 | 1,513 | 1,152 | 1,686 | 1,415 | 1,144 |
| Department of Education | 1,420 | 1,415 | 1,438 | 1,362 | 1,238 | 1,194 | 1,139 | 521 | 1,153 | 1,352 |
| NYC Health + Hospitals | 874 | 908 | 885 | 808 | 693 | 654 | 612 | 541 | 637 | 600 |
| Department of Environmental Protection | 1,123 | 883 | 511 | 539 | 598 | 636 | 691 | 540 | 5,515 | 433 |
| Department of Correction | 2,913 | 3,473 | 4,355 | 4,442 | 4,439 | 4,622 | 3,734 | 2,832 | 3,295 | 4,559 |
| Department of Parks & Recreation | 873 | 887 | 1,058 | 949 | 1,058 | 948 | 905 | 1,123 | 737 | 782 |
| Fire Department | 944 | 951 | 1,010 | 1,004 | 1,198 | 1,090 | 924 | 933 | 1,108 | 1,120 |
| Department of Housing Preservation and Development | 66 | 51 | 64 | 60 | 56 | 93 | 81 | 63 | 118 | 87 |
| NYC Human Resources Administration | 83 | 81 | 81 | 67 | 88 | 73 | 54 | 30 | 40 | 45 |
| Department of Buildings | 52 | 77 | 57 | 55 | 78 | 48 | 45 | 34 | 75 | 38 |
| Other | 2,462 | 2,325 | 2,490 | 2,320 | 2,771 | 2,997 | 2,455 | 2,666 | 2,726 | 2,815 |
| Total | 29,025 | 27,417 | 26,926 | 25,019 | 25,336 | 24,416 | 21,343 | 20,129 | 25,752 | 24,162 |
Table VI – Dollar Amount of Tort Claim Settlements & Judgments by Claim Type, FYs 2014–2024
| 2014 | 2015 | 2016 | 2017 | 2018 | 2019 | 2020 | 2021 | 2022 | 2023 | |
| Personal Injury | ||||||||||
|---|---|---|---|---|---|---|---|---|---|---|
| Sidewalk | 34,463,430 | 39,512,496 | 32,142,833 | 52,351,980 | 47,340,716 | 41,671,630 | 54,604,750 | 64,347,305 | 68,020,745 | 53,455,468 |
| Police Action | 71,948,087 | 119,433,941 | 100,670,673 | 163,760,447 | 119,006,840 | 98,330,389 | 85,601,961 | 78,478,107 | 72,039,610 | 93,131,810 |
| School | 24,568,187 | 33,133,057 | 28,557,445 | 32,340,936 | 29,591,611 | 37,152,131 | 33,857,500 | 29,745,047 | 73,498,537 | 70,575,947 |
| Motor Vehicle | 88,515,029 | 67,350,614 | 89,966,694 | 107,983,405 | 118,588,484 | 109,039,100 | 147,761,065 | 136,562,418 | 141,065,928 | 173,652,500 |
| Roadway | 13,708,374 | 15,369,410 | 31,499,503 | 40,202,115 | 41,093,601 | 37,917,546 | 32,207,326 | 27,204,300 | 43,380,950 | 47,411,478 |
| City Property | 21,797,000 | 4,931,000 | 21,504,554 | 10,405,949 | 9,945,007 | 7,106,475 | 10,681,045 | 10,422,238 | 26,414,500 | 14,154,750 |
| Correction Facility | 7,323,835 | 13,185,550 | 15,696,433 | 16,917,929 | 25,920,851 | 24,820,110 | 30,903,050 | 16,862,379 | 22,278,250 | 27,311,534 |
| Civil Rights | 114,503,798 | 94,359,034 | 157,730,142 | 155,898,649 | 100,359,647 | 107,249,758 | 71,555,143 | 95,216,228 | 143,996,724 | 145,355,214 |
| Medical Malpractice | 118,479,990 | 144,414,243 | 104,106,575 | 110,047,282 | 107,295,963 | 119,143,263 | 92,610,124 | 82,474,254 | 81,083,343 | 51,483,421 |
| Traffic Control Device | 7,594,500 | 604,000 | 2,459,000 | 296,500 | 4,694,250 | 1,617,000 | 12,293,500 | 1,017,000 | 1,618,500 | 353,000 |
| Parks & Recreation | 14,010,209 | 6,130,024 | 8,379,633 | 5,865,220 | 14,126,952 | 11,347,444 | 11,845,200 | 10,039,750 | 11,139,000 | 12,702,500 |
| Uniformed Services Employee | 27,998,500 | 33,439,000 | 26,117,500 | 50,820,225 | 40,097,500 | 58,520,000 | 15,111,000 | 29,288,000 | 31,645,000 | 37,453,500 |
| Other | 13,522,259 | 3,569,893 | 12,165,985 | 6,870,507 | 15,362,543 | 4,515,696 | 4,492,229 | 4,901,576 | 13,903,235 | 6,294,015 |
| Total | 558,433,196 | 575,432,263 | 630,996,970 | 753,761,142 | 673,423,964 | 658,430,541 | 603,523,893 | 586,558,602 | 730,084,321 | 733,335,135 |
| Property Damage | ||||||||||
| Motor Vehicle | 7,403,408 | 5,162,942 | 5,207,672 | 5,742,582 | 4,829,069 | 5,611,057 | 4,620,679 | 4,772,441 | 5,128,291 | 4,274,680 |
| City Property | 67,962 | 16,554 | 90,069 | 55,125 | 157,356 | 18,364 | 4,478 | 3,177 | 456,031 | 128,942 |
| Correction Facility | 2,220 | 665 | 8,475 | 4,426 | 7,757 | 4,419 | 4,726 | 0 | 0 | 0 |
| City Personnel | 1,494,155 | 731,826 | 404,378 | 398,011 | 361,961 | 434,539 | 433,747 | 352,158 | 985,685 | 382,159 |
| Roadway | 192,379 | 215,029 | 537,552 | 137,114 | 101,307 | 53,461 | 286,812 | 31,849 | 104,625 | 114,486 |
| Health Facility | 27,144 | 6,299 | 13,370 | 12,303 | 12,247 | 10,608 | 1,023 | 1,835 | 4,560 | 218 |
| Police Action | 102,697 | 71,487 | 56,155 | 34,639 | 38,643 | 18,639 | 46,158 | 112,263 | 93,170 | 39,966 |
| School | 10,110 | 9,014 | 4,083 | 4,758 | 3,319 | 1,268 | 1,264 | 190 | 0 | 389 |
| Sewer Overflow | 712,861 | 7,224,105 | 1,650,663 | 1,562,963 | 1,505,856 | 474,017 | 307,207 | 976,509 | 193,740 | 137,401 |
| Water Main | 294,175 | 344,127 | 1,437,349 | 553,610 | 304,180 | 712,118 | 1,162,137 | 433,984 | 795,148 | 1,211,911 |
| Other | 25,425 | 9,390 | 23,843 | 2,159,380 | 329,713 | 127,494 | 3,962 | 3,700 | 240 | 3,308 |
| Total | 10,332,536 | 13,791,438 | 9,433,608 | 10,664,911 | 7,651,409 | 7,465,984 | 6,872,192 | 6,688,106 | 7,761,489 | 6,293,461 |
| Grand Total | 568,765,733 | 589,223,701 | 640,430,578 | 764,426,053 | 681,075,373 | 665,896,525 | 610,396,085 | 593,246,708 | 737,845,810 | 739,628,596 |
Table VII – Dollar Amount of Tort Claim Settlements & Judgments by Agency, FYs 2014–2023
| 2014 | 2015 | 2016 | 2017 | 2018 | |
| Department of Transportation | $71,356,361 | $52,735,342 | $70,456,071 | $87,151,968 | $94,193,147 |
| Police Department | $229,846,207 | $225,499,487 | $280,064,079 | $338,183,819 | $238,796,402 |
| Department of Sanitation | $37,886,076 | $29,772,440 | $44,974,303 | $57,695,461 | $77,634,208 |
| Department of Education | $27,237,049 | $36,378,785 | $34,080,031 | $35,526,093 | $32,185,732 |
| NYC Health + Hospitals | $124,887,221 | $121,063,960 | $113,730,458 | $116,968,544 | $108,426,361 |
| Department of Environmental Protection | $13,182,950 | $18,795,525 | $7,281,361 | $8,509,589 | $11,137,443 |
| Department of Correction | $11,103,116 | $27,144,858 | $32,919,412 | $35,658,041 | $33,946,156 |
| Department of Parks & Recreation | $18,343,234 | $13,834,777 | $11,610,274 | $16,709,393 | $21,206,214 |
| Fire Department | $20,426,695 | $46,662,403 | $16,393,652 | $45,277,732 | $25,495,727 |
| Department of Housing Preservation and Development | $2,705,221 | $1,964,125 | $10,855,842 | $776,106 | $5,101,331 |
| NYC Human Resources Administration | $1,008,192 | $970,799 | $1,756,131 | $620,453 | $1,046,699 |
| Department of Buildings | $157,901 | $268,913 | $2,966,514 | $1,386,120 | $77,225 |
| Other | $10,625,510 | $14,132,287 | $13,342,448 | $19,962,735 | $31,828,728 |
| Total | $568,765,733 | $589,223,701 | $640,430,578 | $764,426,053 | $681,075,373 |
| 2019 | 2020 | 2021 | 2022 | 2023 | |
| Department of Transportation | $82,882,200 | $97,848,153 | $88,837,122 | $105,826,606 | $91,243,593 |
| Police Department | $226,737,615 | $210,407,644 | $209,033,497 | $239,120,559 | $266,699,026 |
| Department of Sanitation | $71,773,522 | $39,937,036 | $51,966,956 | $85,319,749 | $75,384,964 |
| Department of Education | $40,885,941 | $39,138,283 | $32,452,653 | $82,581,231 | $92,821,119 |
| NYC Health + Hospitals | $116,839,171 | $95,527,084 | $88,143,137 | $82,749,828 | $54,466,825 |
| Department of Environmental Protection | $13,148,455 | $4,761,865 | $15,783,233 | $9,986,086 | $15,047,832 |
| Department of Correction | $49,083,527 | $36,541,283 | $29,147,625 | $37,456,311 | $38,005,634 |
| Department of Parks & Recreation | $18,687,419 | $24,832,572 | $22,268,744 | $29,276,222 | $23,336,115 |
| Fire Department | $20,955,845 | $30,288,812 | $27,842,070 | $25,917,750 | $45,750,982 |
| Department of Housing Preservation and Development | $3,631,041 | $770,691 | $2,115,851 | $842,188 | $485,000 |
| NYC Human Resources Administration | $788,477 | $501,802 | $2,578,449 | $459,192 | $920,731 |
| Department of Buildings | $1,312,894 | $1,371,015 | $1,421,057 | $1,086,167 | $2,721,834 |
| Other | $19,170,417 | $28,469,844 | $21,656,314 | $37,223,920 | $32,744,941 |
| Total | $665,896,525 | $610,396,085 | $593,246,708 | $737,845,810 | $739,628,596 |
Table VIII – Number of Tort Claim Settlements & Judgments by Claim Type, FYs 2014–2023
| 2014 | 2015 | 2016 | 2017 | 2018 | 2019 | 2020 | 2021 | 2022 | 2023 | |
| Personal Injury | ||||||||||
|---|---|---|---|---|---|---|---|---|---|---|
| Sidewalk | 658 | 661 | 666 | 762 | 559 | 562 | 628 | 581 | 532 | 476 |
| Police Action | 2,250 | 2,276 | 2,481 | 2,530 | 2,500 | 2,338 | 2,455 | 1,757 | 2,059 | 2,031 |
| School | 522 | 482 | 541 | 304 | 319 | 307 | 280 | 256 | 212 | 254 |
| Motor Vehicle | 668 | 584 | 664 | 662 | 614 | 603 | 677 | 561 | 554 | 563 |
| Roadway | 366 | 333 | 371 | 322 | 293 | 313 | 273 | 250 | 255 | 242 |
| City Property | 70 | 38 | 88 | 65 | 51 | 49 | 65 | 49 | 52 | 42 |
| Correction Facility | 378 | 451 | 638 | 803 | 1,050 | 1,220 | 1,295 | 1,058 | 1,212 | 1,124 |
| Civil Rights | 2,047 | 1,683 | 1,353 | 1,019 | 842 | 1,032 | 522 | 411 | 466 | 459 |
| Medical Malpractice | 204 | 243 | 242 | 197 | 228 | 215 | 157 | 118 | 103 | 64 |
| Traffic Control Device | 30 | 20 | 14 | 11 | 15 | 15 | 17 | 18 | 8 | 6 |
| Parks & Recreation | 150 | 136 | 169 | 84 | 104 | 100 | 100 | 86 | 76 | 72 |
| Uniformed Services Employee | 95 | 121 | 111 | 116 | 113 | 90 | 83 | 135 | 92 | 76 |
| Other | 69 | 51 | 65 | 51 | 86 | 39 | 36 | 26 | 54 | 37 |
| Total | 7,507 | 7,079 | 7,403 | 6,926 | 6,774 | 6,883 | 6,588 | 5,306 | 5,675 | 5,446 |
| Property Damage | ||||||||||
| Motor Vehicle | 2,379 | 1,897 | 1,917 | 1,761 | 1,679 | 1,784 | 1,394 | 1,271 | 1,321 | 1,114 |
| City Property | 39 | 6 | 62 | 17 | 9 | 7 | 2 | 2 | 7 | 7 |
| Correction Facility | 5 | 3 | 5 | 5 | 8 | 5 | 3 | 0 | 0 | 0 |
| City Personnel | 408 | 284 | 163 | 147 | 169 | 181 | 182 | 113 | 146 | 149 |
| Roadway | 197 | 287 | 88 | 112 | 72 | 49 | 25 | 11 | 26 | 65 |
| Health Facility | 40 | 17 | 16 | 14 | 22 | 12 | 5 | 3 | 3 | 1 |
| Police Action | 35 | 26 | 18 | 15 | 11 | 11 | 13 | 10 | 12 | 13 |
| School | 35 | 35 | 15 | 16 | 13 | 9 | 3 | 2 | 0 | 3 |
| Sewer Overflow | 144 | 650 | 104 | 47 | 47 | 20 | 35 | 74 | 22 | 20 |
| Water Main | 51 | 38 | 68 | 42 | 46 | 55 | 33 | 43 | 50 | 60 |
| Other | 10 | 6 | 7 | 158 | 19 | 6 | 3 | 1 | 1 | 4 |
| Total | 3,343 | 3,249 | 2,463 | 2,334 | 2,095 | 2,139 | 1,698 | 1,530 | 1,588 | 1,436 |
| Grand Total | 10,850 | 10,328 | 9,866 | 9,260 | 8,869 | 9,022 | 8,286 | 6,836 | 7,263 | 6,882 |
Table IX – Number of Tort Claim Settlements & Judgments by Agency, FYs 2014–2023
| 2014 | 2015 | 2016 | 2017 | 2018 | 2019 | 2020 | 2021 | 2022 | 2023 | |
| Department of Transportation | 1,400 | 1,382 | 1,195 | 1,260 | 981 | 1,015 | 1,011 | 909 | 890 | 845 |
| Police Department | 5,051 | 4,441 | 4,255 | 4,080 | 3,807 | 3,467 | 3,348 | 2,513 | 2,877 | 2,821 |
| Department of Sanitation | 1,426 | 1,134 | 1,188 | 964 | 964 | 913 | 695 | 595 | 716 | 597 |
| Department of Education | 606 | 562 | 595 | 365 | 367 | 367 | 353 | 294 | 259 | 308 |
| NYC Health + Hospitals | 315 | 312 | 361 | 265 | 295 | 271 | 194 | 148 | 132 | 93 |
| Department of Environmental Protection | 292 | 794 | 284 | 327 | 229 | 165 | 142 | 194 | 155 | 148 |
| Department of Correction | 534 | 601 | 842 | 955 | 1,199 | 1,723 | 1,424 | 1,171 | 1,276 | 1,187 |
| Department of Parks & Recreation | 391 | 354 | 352 | 288 | 276 | 273 | 316 | 248 | 235 | 222 |
| Fire Department | 585 | 507 | 489 | 504 | 492 | 502 | 494 | 439 | 438 | 398 |
| Department of Housing Preservation and Development | 14 | 11 | 22 | 12 | 14 | 14 | 7 | 15 | 7 | 7 |
| NYC Human Resources Administration | 18 | 20 | 28 | 20 | 21 | 19 | 14 | 20 | 7 | 9 |
| Department of Buildings | 17 | 12 | 11 | 21 | 8 | 13 | 17 | 17 | 14 | 10 |
| Other | 201 | 198 | 244 | 199 | 216 | 280 | 271 | 273 | 257 | 237 |
| Total | 10,850 | 10,328 | 9,866 | 9,260 | 8,869 | 9,022 | 8,286 | 6,836 | 7,263 | 6,882 |
Table X – Number of Motor Vehicle Claims Filed by Agency, FYs 2014–2023
| 2014 | 2015 | 2016 | 2017 | 2018 | 2019 | 2020 | 2021 | 2022 | 2023 | |
| Department of Transportation | 255 | 211 | 233 | 261 | 300 | 216 | 225 | 261 | 262 | 254 |
| Police Department | 1,409 | 1,295 | 1,385 | 1,299 | 1,325 | 1,457 | 1,280 | 1,160 | 1,020 | 1,196 |
| Department of Sanitation | 1,636 | 1,494 | 1,755 | 1,514 | 1,450 | 1,206 | 909 | 1,167 | 1,068 | 892 |
| Department of Education | 168 | 144 | 124 | 195 | 213 | 188 | 185 | 72 | 214 | 285 |
| NYC Health + Hospitals | 16 | 26 | 22 | 21 | 14 | 17 | 14 | 6 | 18 | 15 |
| Department of Environmental Protection | 136 | 130 | 91 | 121 | 89 | 118 | 84 | 72 | 77 | 61 |
| Department of Correction | 52 | 51 | 94 | 58 | 73 | 67 | 88 | 32 | 29 | 47 |
| Department of Parks & Recreation | 189 | 193 | 210 | 178 | 159 | 131 | 121 | 133 | 118 | 119 |
| Fire Department | 733 | 681 | 806 | 826 | 925 | 879 | 762 | 770 | 870 | 862 |
| Department of Housing Preservation and Development | 11 | 3 | 13 | 12 | 13 | 12 | 11 | 11 | 5 | 10 |
| NYC Human Resources Administration | 14 | 15 | 13 | 14 | 6 | 16 | 7 | 3 | 2 | |
| Department of Buildings | 14 | 11 | 11 | 16 | 21 | 15 | 15 | 17 | 20 | 12 |
| Other | 309 | 345 | 368 | 335 | 467 | 418 | 369 | 431 | 378 | 416 |
| Total | 4,942 | 4,599 | 5,125 | 4,850 | 5,055 | 4,740 | 4,070 | 4,132 | 4,082 | 4,171 |
Table XI – Dollar Amount of Motor Vehicle Claim Settlements & Judgments by Agency, FYs 2014–2023
| 2014 | 2015 | 2016 | 2017 | 2018 | 2019 | 2020 | 2021 | 2022 | 2023 | |
| Department of Transportation | 9,488,082 | 1,221,489 | 2,502,780 | 4,016,421 | 7,404,733 | 4,019,376 | 5,342,867 | 6,669,461 | 8,166,864 | 6,174,737 |
| Police Department | 44,535,637 | 15,441,899 | 36,858,793 | 42,741,440 | 36,228,521 | 46,882,196 | 74,155,670 | 49,439,440 | 42,172,660 | 56,051,238 |
| Department of Sanitation | 23,584,031 | 14,670,334 | 30,479,392 | 36,704,897 | 45,697,504 | 26,263,588 | 27,367,918 | 34,537,170 | 44,237,352 | 47,236,081 |
| Department of Education | 271,562 | 263,028 | 40,074 | 747,796 | 36,252 | 797,152 | 608,985 | 906,633 | 224,690 | 3,589,928 |
| NYC Health + Hospitals | 1,566,616 | 134,663 | 2,854 | 38,896 | 90,400 | 9,496 | 468,000 | 213,430 | 103,675 | 15,686 |
| Department of Environmental Protection | 2,471,430 | 8,498,159 | 2,784,557 | 2,122,340 | 4,786,088 | 8,218,452 | 2,035,004 | 8,623,359 | 7,654,277 | 4,995,696 |
| Department of Correction | 679,009 | 1,013,607 | 213,028 | 1,075,576 | 1,733,699 | 205,360 | 283,234 | 3,013,991 | 1,388,958 | 1,292,454 |
| Department of Parks & Recreation | 2,183,353 | 6,930,975 | 3,023,997 | 3,812,578 | 5,206,149 | 4,844,826 | 8,371,021 | 5,097,707 | 7,668,211 | 7,003,676 |
| Fire Department | 9,045,658 | 18,092,282 | 11,848,759 | 11,443,942 | 16,189,581 | 14,692,966 | 25,181,906 | 24,871,962 | 19,881,065 | 41,484,950 |
| Department of Housing Preservation and Development | 138,721 | 1,547,625 | 149,842 | 376,711 | 40,249 | 2,206,041 | 161,791 | 48,114 | 3,688 | 295,000 |
| NYC Human Resources Administration | 89,074 | 665,695 | 79,445 | 116,453 | 189,699 | 31,777 | 75,302 | 1,377,449 | 202,692 | 750,730 |
| Department of Buildings | 41,351 | 30,954 | 143,000 | 812,873 | 72,025 | 1,156,394 | 997,302 | 898,052 | 825,167 | 2,591,834 |
| Other | 1,823,912 | 4,002,848 | 7,047,846 | 9,716,064 | 5,742,654 | 5,322,533 | 7,332,746 | 5,638,090 | 13,664,919 | 6,445,171 |
| Total | 95,918,437 | 72,513,557 | 95,174,366 | 113,725,987 | 123,417,554 | 114,650,157 | 152,381,744 | 141,334,859 | 146,194,218 | 177,927,180 |
Table XII – Number of Motor Vehicle Claim Settlements & Judgments by Agency, FYs 2014–2023
| 2014 | 2015 | 2016 | 2017 | 2018 | 2019 | 2020 | 2021 | 2022 | 2023 | |
| Department of Transportation | 140 | 106 | 96 | 115 | 112 | 142 | 132 | 97 | 123 | 127 |
| Police Department | 827 | 653 | 616 | 697 | 622 | 670 | 571 | 482 | 476 | 453 |
| Department of Sanitation | 1,154 | 942 | 1,040 | 798 | 755 | 750 | 574 | 509 | 565 | 475 |
| Department of Education | 16 | 16 | 9 | 10 | 6 | 11 | 9 | 9 | 5 | 6 |
| NYC Health + Hospitals | 14 | 13 | 2 | 8 | 2 | 3 | 5 | 6 | 4 | 3 |
| Department of Environmental Protection | 103 | 83 | 80 | 65 | 64 | 59 | 52 | 55 | 60 | 39 |
| Department of Correction | 44 | 23 | 42 | 28 | 44 | 21 | 29 | 21 | 15 | 19 |
| Department of Parks & Recreation | 120 | 107 | 99 | 116 | 109 | 84 | 90 | 82 | 83 | 55 |
| Fire Department | 500 | 417 | 461 | 458 | 455 | 469 | 462 | 413 | 385 | 368 |
| Department of Housing Preservation and Development | 8 | 4 | 8 | 6 | 5 | 9 | 3 | 8 | 2 | 4 |
| NYC Human Resources Administration | 8 | 11 | 7 | 10 | 8 | 8 | 4 | 5 | 2 | 2 |
| Department of Buildings | 11 | 8 | 5 | 16 | 7 | 10 | 8 | 12 | 11 | 8 |
| Other | 102 | 98 | 116 | 96 | 104 | 151 | 132 | 133 | 144 | 118 |
| Total | 3,047 | 2,481 | 2,581 | 2,423 | 2,293 | 2,387 | 2,071 | 1,832 | 1,875 | 1,677 |
Table XIII – Number of Law Claims Filed by Claim Type
FYs 2014–2023
| 2014 | 2015 | 2016 | 2017 | 2018 | 2019 | 2020 | 2021 | 2022 | 2023 | |
| Affirmative | 914 | 1,128 | 1,048 | 1,132 | 1,054 | 1,098 | 578 | 317 | 531 | 792 |
| Contract | 132 | 150 | 152 | 151 | 88 | 98 | 96 | 63 | 125 | 73 |
| Disputes | 177 | 117 | 172 | 120 | 88 | 95 | 77 | 149 | 126 | 80 |
| Equitable | 6 | 4 | 11 | 13 | 14 | 16 | 3 | 8 | 6 | 3 |
| Refund | 223 | 182 | 157 | 132 | 132 | 128 | 108 | 67 | 69 | 49 |
| Salary | 93 | 95 | 97 | 73 | 78 | 89 | 78 | 51 | 55 | 91 |
| Special Education | 2,581 | 4,479 | 4,094 | 4,183 | 5,102 | 4,588 | 6,084 | 6,022 | 5,642 | 7,492 |
| Other | 251 | 264 | 253 | 288 | 375 | 331 | 303 | 330 | 266 | 396 |
| Total | 4,377 | 6,419 | 5,984 | 6,092 | 6,931 | 6,443 | 7,327 | 7,007 | 6,820 | 8,976 |
Table XIV – Number of Law Claim Settlements & Judgments by Claim Type, FYs 2014–2023
| 2014 | 2015 | 2016 | 2017 | 2018 | 2019 | 2020 | 2021 | 2022 | 2023 | |
| Affirmative | 899 | 1,111 | 1,015 | 986 | 874 | 938 | 492 | 260 | 409 | 580 |
| Contract | 26 | 22 | 34 | 31 | 25 | 26 | 20 | 21 | 14 | 11 |
| Disputes | 44 | 45 | 62 | 37 | 38 | 43 | 32 | 23 | 23 | 16 |
| Equitable | 2 | 6 | 2 | 5 | 5 | 4 | 5 | 1 | 0 | 2 |
| Refund | 14 | 18 | 20 | 9 | 12 | 7 | 2 | 10 | 4 | 1 |
| Salary | 23 | 286 | 30 | 26 | 20 | 28 | 26 | 22 | 25 | 20 |
| Special Education | 2,223 | 4,067 | 3,773 | 3,969 | 4,592 | 4,255 | 5,410 | 3,663 | 4,641 | 5,626 |
| Other | 28 | 38 | 46 | 44 | 57 | 52 | 35 | 58 | 62 | 89 |
| Total | 3,259 | 5,593 | 4,982 | 5,107 | 5,623 | 5,353 | 6,022 | 4,058 | 5,178 | 6,345 |
Table XV – Dollar Amount of Law Claim Settlements & Judgments by Claim Type*, FYs 2014–2023
| 2014 | 2015 | 2016 | 2017 | 2018 | |
| Contract | $19,573,476 | $44,846,785 | $49,626,492 | $45,886,058 | $61,104,852 |
| Disputes | $7,325,629 | $3,001,135 | $6,116,577 | $5,261,545 | $7,530,717 |
| Equitable | $76,576 | $616,256 | $25,143 | $1,142,203 | $416,018 |
| Refund | $116,834 | $697,973 | $14,207,059 | $59,594 | $1,089,853 |
| Salary | $104,468,018 | $65,511,792 | $16,548,145 | $7,591,767 | $10,086,357 |
| Special Education | $130,450,454 | $249,944,721 | $256,466,671 | $279,617,259 | $304,139,428 |
| Other | $7,541,036 | $6,734,055 | $38,263,330 | $3,760,839 | $16,696,196 |
| Total | $269,552,023 | $371,352,717 | $381,253,416 | $343,319,265 | $401,063,421 |
| 2019 | 2020 | 2021 | 2022 | 2023 | |
| Contract | $54,028,810 | $49,804,421 | $113,758,674 | $55,526,038 | $44,272,431 |
| Disputes | $3,858,078 | $2,909,349 | $9,743,639 | $3,229,234 | $777,235 |
| Equitable | $645,160 | $637,016 | $260,000 | $0 | $274,400 |
| Refund | $17,639 | $1,294 | $73,093 | $5,784 | $962 |
| Salary | $7,819,929 | $61,506,112 | $18,036,708 | $437,521,458 | $260,777,106 |
| Special Education | $285,879,716 | $360,509,895 | $224,865,047 | $303,487,221 | $397,039,917 |
| Other | $11,371,349 | $7,278,655 | $10,343,799 | $21,505,345 | $5,657,662 |
| Total | $363,620,681 | $482,646,742 | $377,080,959 | $821,275,079 | $708,799,714 |
*Figures on law claim settlements and judgments dollar amount do not include claims wherein the City is to receive payment.
Table XVI – Number of Law Claim Settlements & Judgments by Agency, FYs 2014–2023
| 2014 | 2015 | 2016 | 2017 | 2018 | 2019 | 2020 | 2021 | 2022 | 2023 | |
| Department of Transportation | 15 | 13 | 11 | 5 | 14 | 5 | 8 | 9 | 10 | 12 |
| Police Department | 162 | 272 | 179 | 127 | 107 | 108 | 41 | 23 | 23 | 26 |
| Department of Sanitation | 5 | 11 | 8 | 6 | 8 | 7 | 7 | 2 | 0 | 5 |
| Department of Education | 2,294 | 4,139 | 3,806 | 4,013 | 4,603 | 4,261 | 5,401 | 3,599 | 4,598 | 5,584 |
| NYC Health + Hospitals | 7 | 11 | 4 | 3 | 9 | 8 | 5 | 2 | 4 | 5 |
| Department of Environmental Protection | 19 | 22 | 19 | 18 | 18 | 22 | 18 | 31 | 23 | 22 |
| Department of Correction | 2 | 5 | 5 | 4 | 3 | 11 | 10 | 10 | 10 | 13 |
| Department of Parks & Recreation | 11 | 12 | 14 | 18 | 9 | 18 | 13 | 10 | 7 | 11 |
| Fire Department | 8 | 269 | 9 | 2 | 7 | 10 | 17 | 16 | 34 | 9 |
| Department of Housing Preservation and Development | 352 | 441 | 536 | 505 | 459 | 532 | 260 | 124 | 168 | 361 |
| NYC Human Resources Administration | 215 | 237 | 196 | 236 | 196 | 191 | 123 | 39 | 104 | 63 |
| Department of Buildings | 7 | 13 | 8 | 9 | 7 | 5 | 18 | 17 | 19 | 20 |
| Other | 162 | 148 | 187 | 161 | 183 | 175 | 101 | 176 | 178 | 214 |
| Total | 3,259 | 5,593 | 4,982 | 5,107 | 5,623 | 5,353 | 6,022 | 4,058 | 5,178 | 6,345 |
Table XVII – Dollar Amount of Law Claim Settlements & Judgments by Agency*, FYs 2014–2023
| 2014 | 2015 | 2016 | 2017 | 2018 | 2019 | 2020 | 2021 | 2022 | 2023 | |
| Department of Transportation | $6,543,036 | $1,197,424 | $5,242,328 | $2,255,804 | $3,987,337 | $232,825 | $622,000 | $5,424,589 | $1,577,084 | $1,563,450 |
| Police Department | $11,265,683 | $51,691,859 | $16,308,910 | $118,500 | $244,656 | $536,320 | $28,630,820 | $509,025 | $2,279,862 | $487,215 |
| Department of Sanitation | $2,972,596 | $6,373,802 | $20,492,609 | $303,735 | $6,541,368 | $1,475,864 | $23,188,000 | $5,905,000 | $0 | $36,400 |
| Department of Education | $134,737,413 | $251,205,609 | $269,883,342 | $287,077,018 | $310,439,218 | $291,228,440 | $370,029,487 | $226,480,528 | $668,288,038 | $611,844,204 |
| NYC Health + Hospitals | $753,019 | $185,070 | $857,166 | $0 | $759,152 | $879,330 | $20,810,771 | $57,129 | $95,102 | $542,350 |
| Department of Environmental Protection | $12,245,172 | $33,515,275 | $20,235,809 | $33,921,698 | $10,563,893 | $24,622,786 | $11,107,963 | $95,807,556 | $48,989,609 | $14,057,686 |
| Department of Correction | $676,313 | $98,916 | $3,484,240 | $636,894 | $995,888 | $667,549 | $583,319 | $569,863 | $1,848,387 | $2,257,065 |
| Department of Parks & Recreation | $72,442 | $1,999,321 | $720,037 | $2,273,827 | $6,111,972 | $613,728 | $15,117,300 | $268,009 | $1,034,713 | $1,466,294 |
| Fire Department | $91,615,078 | $13,235,289 | $15,559,945 | $963,060 | $663,007 | $1,918,543 | $704,649 | $462,538 | $1,585,558 | $451,099 |
| Department of Housing Preservation and Development | $197,143 | $35,852 | $1,165,433 | $686,941 | $1,440,464 | $158,172 | $84,684 | $13,750 | $377,108 | $42,130 |
| NYC Human Resources Administration | $175,000 | $2,019,969 | $571,182 | $1,839,499 | $36,090,772 | $372,659 | $36,000 | $69,500 | $19,751,120 | $13,421,851 |
| Department of Buildings | $75,585 | $46,000 | $127,300 | $0 | $7,000 | $0 | $78,250 | $5,750 | $0 | $236,667 |
| Other | $8,223,545 | $9,748,332 | $26,605,116 | $13,242,290 | $23,218,694 | $40,914,467 | $12,352,800 | $41,519,721 | $75,751,098 | $62,480,202 |
| Total | $269,552,023 | $371,352,717 | $381,253,416 | $343,319,265 | $401,063,421 | $363,620,681 | $483,346,042 | $377,092,959 | $821,577,679 | $708,886,614 |
*Figures on law claim settlements and judgments dollar amount do not include claims wherein the City is to receive payment.
Endnotes
[1] City Charter Chapter 5, § 93(i).
[2] The Comptroller’s Office records claims data in its Omnibus Automated Image Storage and Information System (OAISIS). This report is based on data available in OAISIS as of January 17, 2024. Since OAISIS is a dynamic system that is updated constantly, data in this report does not reflect values for matters that have settled but have not yet been recorded in OAISIS.
[3] New York City’s tort claim costs are paid from the Judgments and Claims account established annually in the City’s General Fund, except H+H assumes financial responsibility for its settlements.
[4] See Appendix A for a description of claim types.
[5] False arrest, malicious prosecution, excessive force, and related claims are categorized as police action claims if filed in state court and as civil rights claims if filed in federal court. The claim types are separately tracked so they are not double counted.
[6] In FY 2019, the City resolved the Parker Class Action against DOC. For administrative purposes, the 395 eligible claimants were given separate claim numbers for efficiency in tracking, lien searches, and payment. For purposes of claim tracking in this report, these 395 claims are treated as one claim filed and one settlement. This year’s claim report corrects any minor tabulation errors regarding the Parker Class Action from past reports.
[7] Percentages are rounded and, therefore, do not total 100 percent.
[8] The City continues to resolve additional protest-related matters through FY 2023, including the Mott Haven Class Action settlement, which will affect future NYPD payouts at yet-to-be determined figures. These settlements will be further addressed in the FY 2024 Reports.
[9] Governor Andrew Cuomo signed the Child Victim’s Act (CVA) on February 14, 2019. As relevant to civil lawsuits against the City, the CVA modified existing law as follows:
- The statute of limitation for all new civil actions alleging personal injury arising out of sexual abuse of a child is permanently extended to until the victim turns 55 – or 37 years past the age of 18. Further, any new filing against a municipality for sexual abuse of a child no longer requires a notice of claim as a condition precedent to commencing litigation.
- “Look Back Window”: Previously time-barred actions were revived, without limitation, during a one-year period commencing on August 14, 2019, and ending on August 14, 2020 (and subsequently extended to August 14, 2021 due to the COVID-19 pandemic). No claim revived against a municipality required a notice of claim.
- CVA cases are given a special trial preference in litigation (i.e., will be on an expedited discovery and trial schedule).
- The Courts are required to appropriately train judges as to sexual abuse cases involving minors and the Chief Judge must promulgate rules that allow for timely adjudication of CVA cases.
[10] Certain New York City employees, including sanitation workers, firefighters, police officers, and public school teachers, are not eligible for Workers’ Compensation and may file a claim with the City of New York.
[11] H+H operates 11 acute care hospitals.
[12] Personal injury and property damage claims are analyzed by borough based on location of incident. Some notices of claim are filed without borough specific information or allege incidents that occurred outside the five boroughs. Law claims are not tracked by borough. Population statistics do not take into account commuters or tourists.
[13] 2,871 Personal Injury claims were filed against the Department of Corrections facilities located in Bronx County in FY 2022.
[14] The United States Census Bureau estimated July 1, 2023 population for New York City was 8,258,035 residents. In order of population the boroughs are: Brooklyn (2,561,225 or 31.0 percent of the total population); Queens (2,252,196 or 27.3 percent of the total population); Manhattan (1,597,451 or 19.3 percent of the total population); Bronx (1,356,476 or 16.4 percent of the total population); and Staten Island (490,687 or 5.9 percent of the total population). Statistics do not take into account commuters and tourists.
[15] While the total number of law claim settlements and judgments includes all resolved law claims, law claim settlement and judgment payment figures do not include claims wherein the City is to receive payment.
[16] Settled dispute claims only reflect those disputes for which the contractor and the Comptroller’s Office have agreed to a settlement that involves a monetary payout. These settlements do not include dispute claims where the Comptroller’s Office has issued a contract interpretation determination that has been accepted by the contractor.
[17] For the purposes of the Claims Report, “filed” describes those claims in which a notice of claim was filed with the Comptroller’s Office or the Law Department requested a claim number assigned for a case in litigation; “settled” means any claim or lawsuit that was resolved, either by settlement or judgment, and resulted in payment of money to claimant, plaintiff, or the City.
[18] NY Exec. Law § 632-a(1)(a), (b).
[19] Bernadine v. City of New York, 294 N.Y. 361, 365 (1945).
[20] Id.
[21] Court of Claims Act of 1920, L. 1920, ch. 922, and L. 1929, ch. 467, § 1.
[22] General Municipal Law, Article § 50-e. Effective September 2010, claimants can file personal injury and property damage claims electronically through the Comptroller’s website (http://comptroller.nyc.gov/services/for-the-public/claims/file-a-claim/).
[23] General Municipal Law, Article 4, § 50-e. One notable exception is a claim under 42 U.S.C. § 1983, the Federal Civil Rights Act; a § 1983 action can be filed directly in court without filing a notice of claim if no state cause of action is asserted.
[24] City Charter, Chapter 5, § 93(i).
[25] BLA investigates claims filed against the City; obtains and evaluates accident reports and other documents provided by City agencies; conducts hearings; evaluates liability and damages; and attempts to settle appropriate claims. The Comptroller’s Office Bureau of Engineering assists BLA in investigating construction related claims and negotiating claim settlements.
[26] General Municipal Law, Article 4, § 50-i. A significant exception to this requirement is in the area of medical malpractice, in particular, claims for injuries to newborn infants.
[27] City Charter, Chapter 17, § 394(c).