COVID-19 & Air Quality in Utah
Results and analysis from the Department of Atmospheric Sciences
![]()
Air quality improvements during the March-April Covid-19 lockdown
Preliminary analysis by Dr. Logan Mitchell, Research Assistant Professor
Contact information: logan.mitchell@utah.edu
May 5, 2020
Introduction
The Covid-19 lockdowns represent a unique natural experiment where emissions have decreased dramatically over a short period of time. This presents an opportunity for atmospheric scientists to understand how emissions affect air quality and greenhouse gas concentrations in our air, and ultimately the impacts on human health and ecosystems.
Background
The Covid-19 pandemic and efforts to prevent the exponential spread of the virus are causing severe socioeconomic disruptions. Social distancing policies have been adopted across the US and globally to “flatten” the infection curve and ensure that health care systems are not overwhelmed. In Utah, Gov. Gary Herbert declared a state of emergency on March 6th, 2020, and on March 16th 2020 Salt Lake County issued a public health order closing many business and places of mass gathering. These actions caused a rapid decrease in emissions from traffic and commercial sectors that has resulted in a noticeable improvement in air quality. Here, I provide an initial analysis showing how the air quality on the Wasatch Front has improved as a result of Utah’s Covid-19 “Stay Safe, Stay Home” policies.
Summary of the significant findings & implications
- Air quality along the Wasatch Front in March is usually "good” on the Air Quality Index (AQI), but the reduction in emissions this March have made air quality even better than usual; adverse health impacts can be experienced even with low amounts of air pollution, making reductions within the “good” AQI notable
- Recent improvements in air quality from a ~40-50% reduction in traffic are what would be expected all the time if 40-50% of cars were electric
- Local air quality improves immediately after emissions are reduced, demonstrating that future actions to improve air quality could yield immediate results
Summary of March trends in air quality indicators & greenhouse gasses
- Traffic reductions have lowered nitrogen oxides (NOx), especially during rush hour peaks
- Lower Nitrogen Dioxide (NO2) is observed in surface and satellite data sets
- Ozone (O3) is about the same midday as usual but it’s slightly elevated at night due to decreased chemical reactions between O3 and NOx (lower NOx titration)
- Fine particulate matter (PM5) is lower than average, particularly at night, although the cause of this reduction is unknown and will be the subject of further research
- Sulphur dioxide (SO2) is normally low along the Wasatch Front and this year SO2 is about the same as usual
- Excess carbon dioxide (CO2) above background conditions is lower than average at two sites in the urban center, but slightly elevated in the southwest Salt Lake Valley from long-term suburban expansion
CAVEAT: This analysis is preliminary, will be updated as more data come in, and has not been peer reviewed.
A Note About these Extraordinary Times
While large improvements in air quality have occurred during this pandemic, these benefits are overshadowed by the steep costs to health, the economy, and other aspects of society. My hope is that this data and analysis can help provide an vision for improved air quality as we recover from this pandemic.
March Air Quality in Utah
Air quality in Utah in March is generally in the “Good” Air Quality Index (AQI) category, as can be seen over multiple years even before 2020 (Figure 1). However, the “Good” AQI category represents a range of air pollutant concentrations, so simply looking at the AQI category cannot tell you how air quality has improved during the Covid-19 lockdown.
 Figure 1. Daily AQI values, 1995-2020 in Salt Lake City, UT.
Improved Air Quality at Utah DAQ’s Hawthorne Site
The air quality “supersite” at the Hawthorne Elementary School at 1700 S 700 E in Salt Lake City, operated by the Utah Division of Air Quality, provides a comprehensive suite of air quality measurements that extend back decades. That makes it ideal to compare how air pollutant concentrations in March-April 2020 compare to concentrations in prior years. Figure 2 shows the average 24-hour profile of five pollutants measured at Hawthorne. The blue line shows the long-term 2010-2019 average concentrations and the shading indicates 1-standard deviation.
 Figure 2. Pollutant concentrations by hour of day observed at the Utah DAQ Hawthorne
site.
Figure 2. Pollutant concentrations by hour of day observed at the Utah DAQ Hawthorne
site.
Changes in NOx-Ozone
The biggest change in air quality is due to reduced traffic volume, which the Utah DOT estimated declined by ~40-50% during the peak of the lockdown efforts. Vehicles emit nitrogen oxide (NO) that react chemically in the air to form nitrogen dioxide (NO2) and ozone (O3). NO and NO2 together are referred to as NOx. NO concentrations were ~57% lower than average while NO2 concentrations were ~36% lower than the long-term average. The reductions in NO are particularly apparent during the morning and evening rush hour time periods, while NO2 was lowered throughout the day. These reductions in emissions from a 40-50% reduction in traffic could also be obtained if 40-50% of the cars along the Wasatch Front were electric, thereby removing those tailpipe emissions.
While NOx plays an important role in the photochemical reactions that produce and destroy ozone, NOx is not the only ingredient needed for ozone formation. Volatile Organic Compounds (VOCs) and sunlight are also needed to form ground-level ozone during the day. Along the Wasatch Front in March, NOx is not the limiting ingredient in ozone formation and so concentrations in the middle of the day are about the same as the long-term average. However, at night when there is no sunlight, NOx chemically destroys ozone, a process called NOx “titration” of ozone. Since NOx has been lower during the lockdown, there is not as much nighttime NOx titration and therefore nighttime ozone concentrations have been slightly elevated compared to the long-term average. This flatting of the daily ozone cycle is a characteristic atmospheric chemistry fingerprint of lower NOx emissions and is consistent with published modeled expectations of what a low-NOx urban emissions regime would look like (see Figure 10 and 11 in Pfister et al., 2014).
Changes in PM2.5
Fine particulate matter (PM2.5) is one of the primary pollutants of concern along the Wasatch Front because of elevated concentrations during wintertime inversions. Typically, in March/April PM2.5 is low, but this year PM2.5 concentrations are 41% lower than usual, with the biggest difference seen at night. Since PM2.5 can come from direct emissions or can be formed from chemical reactions, the lower concentrations this year present a compelling scientific question about what caused the reduction: was it because of lower direct emissions of PM2.5 or was it because other pollutants were lower and there was reduced chemical reactions forming secondary PM2.5? It will require additional analyses to determine the ultimate cause of this reduction and the answer may hold clues about what the most effective policies are to lower PM2.5 during our winter inversions. A group of researchers, including several in Atmospheric Sciences at the University of Utah, are currently planning a future field campaign called the AQUARIUS project that will use an aircraft to investigate the atmospheric chemistry that forms PM2.5 during winter inversions. Understanding what affects PM2.5 formation even at low levels is critically important because PM2.5 has adverse health effects even at low concentrations in the “good” AQI category (e.g. Di et al., 2017).
No change in SO2
Sulphur Dioxide (SO2) is not directly a pollutant of concern along the Wasatch Front, and has not been since the 1970s. This year we are not seeing much difference in our typically low SO2 concentrations.
Comparisons with satellite imagery
Some of the most striking imagery of improved air quality has come from satellite observations of NO2 in cities around the world, and we see similar patterns along the Wasatch Front. Data from the Sentinel-5P satellite became available in mid-2018 so we can’t examine a long time period like is possible with the surface observations. However, the difference in average conditions on March 15-30 between 2019 and 2020 is stark (Figure 3). Having both ground- and satellite-based observations in agreement with each other provides additional confidence in the magnitude of air quality improvements during the Covid-19 lockdown. An interactive version of Figure 3 can be seen here.
 Figure 3. Comparison of NO2 along the Wasatch front from late March in 2019 vs. 2020. Satellite NO2 observations are from the Tropomi instrument on the Sentinal-5 satellite. Red colors
indicate higher concentrations of NO2.
Figure 3. Comparison of NO2 along the Wasatch front from late March in 2019 vs. 2020. Satellite NO2 observations are from the Tropomi instrument on the Sentinal-5 satellite. Red colors
indicate higher concentrations of NO2.
Reductions in Carbon Dioxide emissions
Carbon Dioxide (CO2) is an important greenhouse gas that contributes to the changing climate and is co-emitted with air pollutants during fossil fuel combustion. Current estimates suggest that the Covid-19 lockdown may decrease global CO2 emissions by ~8% this year, although this is a preliminary estimate dependent on many factors that will be determined in the coming months. We have a unique opportunity to observe how CO2 is being affected by the Covid-19 lockdown in the Salt Lake Valley because we have one of the longest running urban CO2 monitoring networks in the world, the Utah Urban CO2 Network (UUCON) (Bares et al., 2019). Unlike other air pollutants, CO2 is a relatively stable species that builds up in the atmosphere. For this reason, in order to observe the impact of reduced emissions during the Covid-19 lockdown, we must first subtract the ‘background’ concentrations to reveal the CO2 excess, a quantity that is proportional to local CO2 emissions. For this analysis, I used a running percentile method to determine the background CO2, which was then subtracted from the measured concentrations to yield the excess CO2.
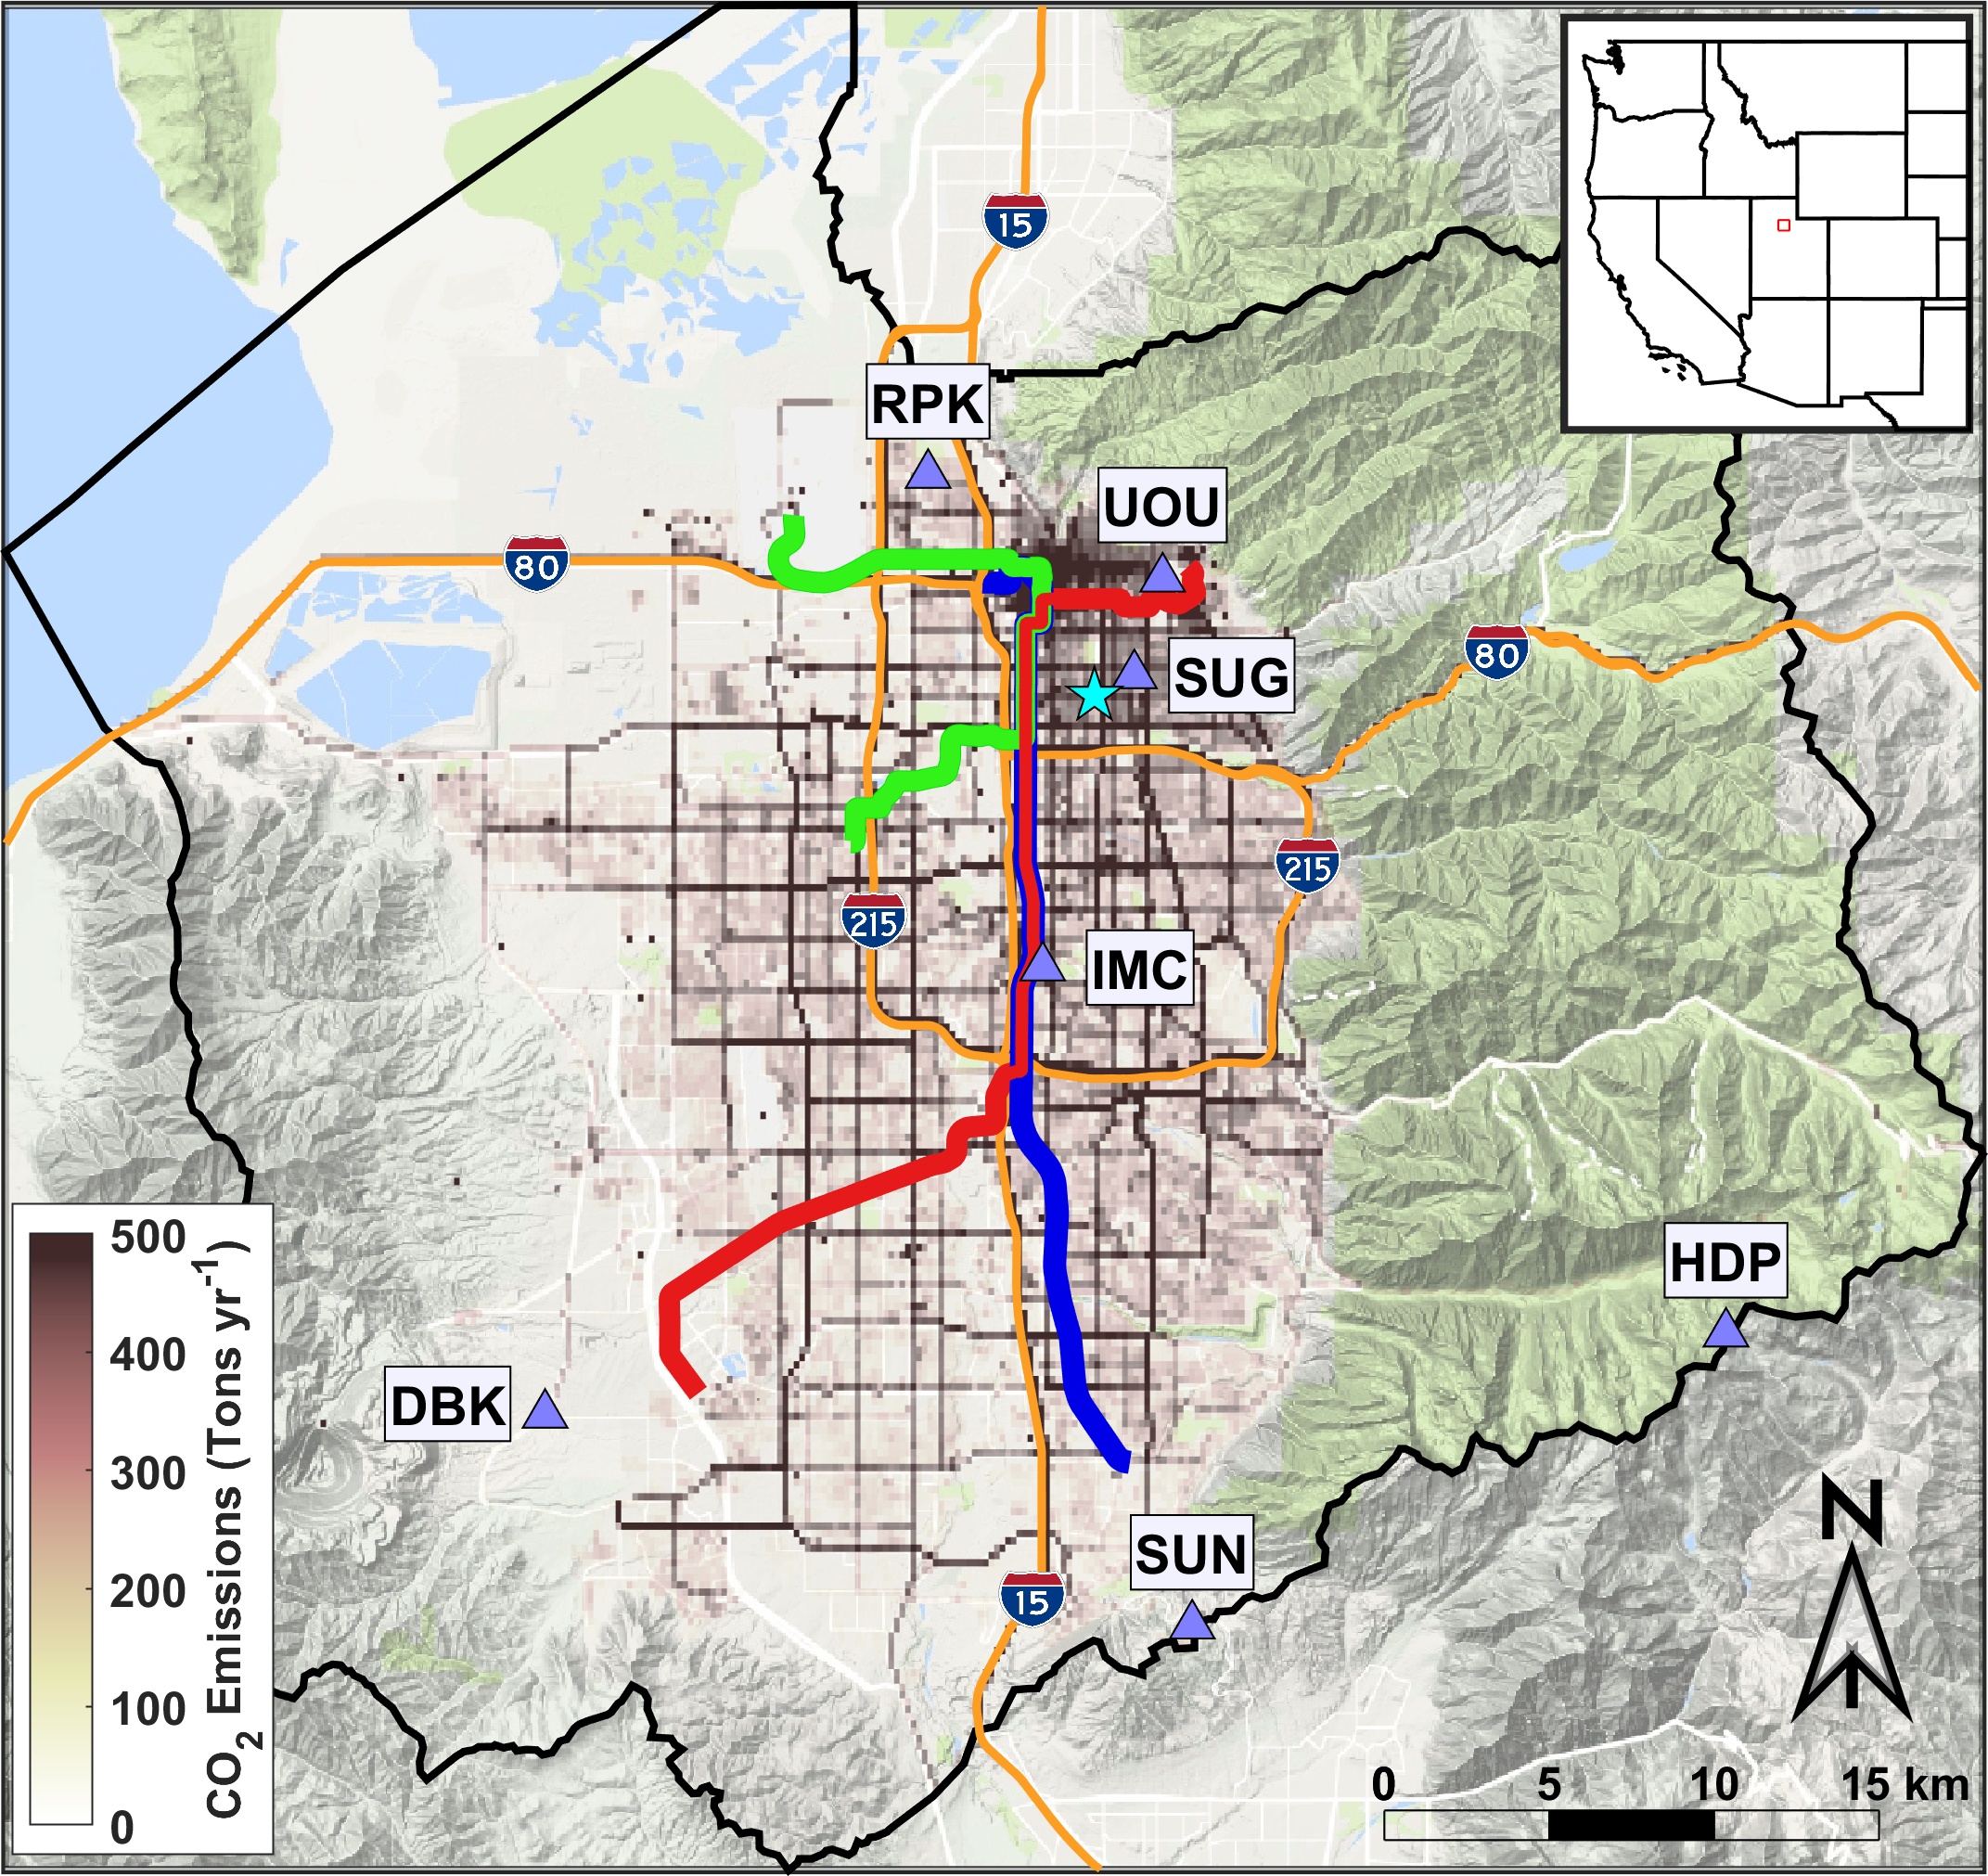 Figure 4. Map of CO2 monitoring sites in the Salt Lake Valley (purple triangles). The Utah DAQ Hawthorne
monitoring site is indicated by the light blue star.
Figure 4. Map of CO2 monitoring sites in the Salt Lake Valley (purple triangles). The Utah DAQ Hawthorne
monitoring site is indicated by the light blue star.
During the Covid-19 lockdown, three of our CO2 monitoring sites have been operating: the UOU, SUG, and DBK sites (Figure 4). The observed excess CO2 from these three sites align with our expectations (Figure 5). The UOU and SUG sites both have lower excess CO2 compared to the long-term average (33% and 19% lower than average, respectively). The higher excess CO2 observed at the DBK site at first seems counterinitiative; however, this is the continuation of a long-term trend that has been previously reported (Mitchell et al., 2018). In the past 15 years there has been substantial urban development in the southwest quadrant of the Salt Lake Valley, and this development has brought higher CO2 emissions to the area. So, even though emissions are likely lower than they otherwise would be this year because of the Covid-19 lockdown, they are still higher than they were before that area was developed.
 Figure 5. CO2 concentrations by hour of day observed at three of the UUCON monitoring sites.
Additional analysis coming
Since this is an unprecedented and ongoing event, there will be an immense amount of research conducted to better understand emissions, atmospheric composition, and impacts on human health and ecosystems. As more analysis and results become available, they will be added to this page.
Acknowledgements
This initial analysis would not be possible without the support of many people and agencies. Thanks go to the Utah Division of Air Quality for providing long-term measurements and valuable collaboration. Thanks also go to the Utah Atmospheric Trace Gas and Air Quality (U-ATAQ) lab for maintaining the CO2 monitoring network, the institutions that host CO2 monitoring sites, Google Earth Engine for analysis tools, and the Copernicus Sentinel science team for providing satellite NO2 data. Funding support came from the NOAA Climate Program Office’s Atmospheric Chemistry, Carbon Cycle, and Climate program (NA17OAR4310084).